Once we have created .GRD files of our images and .DAT tab delimited (or Excel files) containing our data point label information, we can start Surfer and load our GRD file by clicking the Color Relief plot icon and select our .GRD file as seen here:
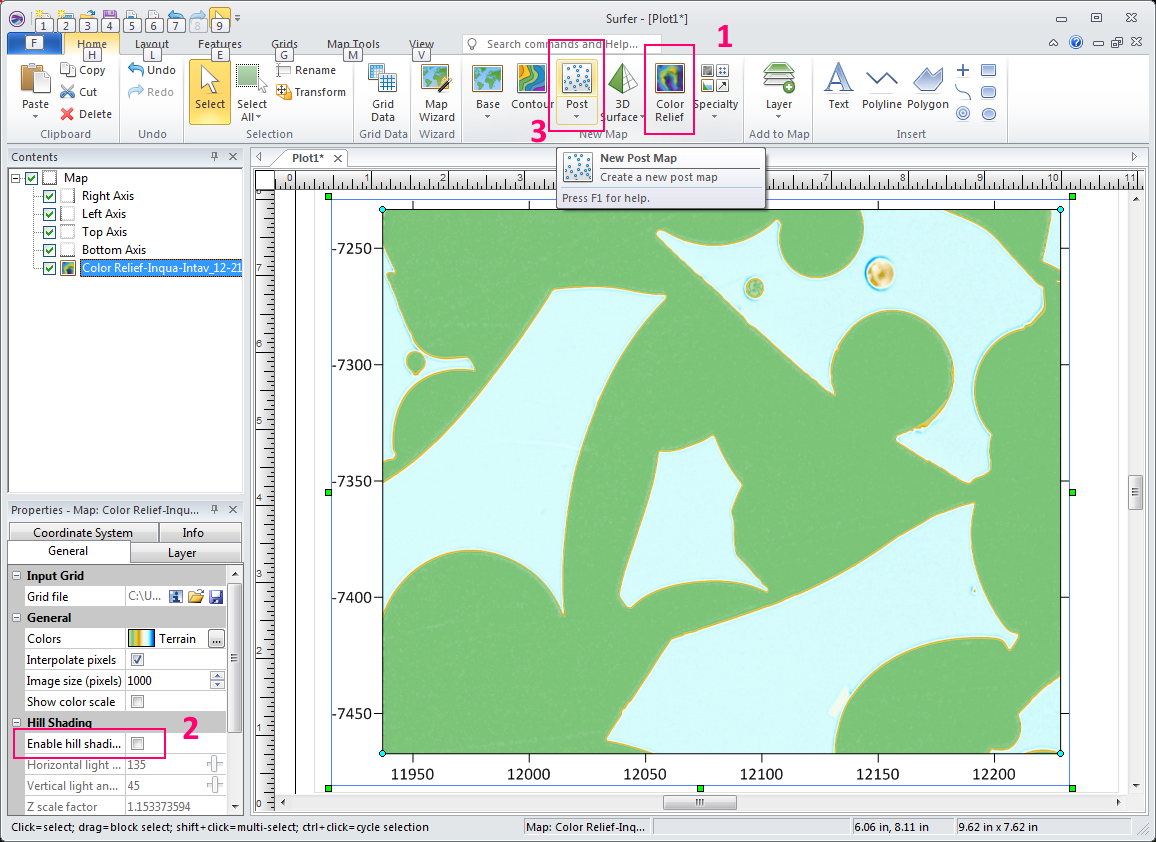
Note that when you first load a GRD file using the color relief option (red outline #1) it will display the image with "hill shading" (it's a feature not a bug!). So to turn off hill shading, simply uncheck the checkbox labeled Enable Hill Shading (red outline #2). We then click the Post icon (red outline #3) and we can see our data points displayed as seen here:
Note that one can select either a Post or a Classed Post option. The Post option displays the data point symbols as a specified size, while the Classed Post option displays data point symbols related to a data column. So for example one could make the symbol size proportional to the data value.
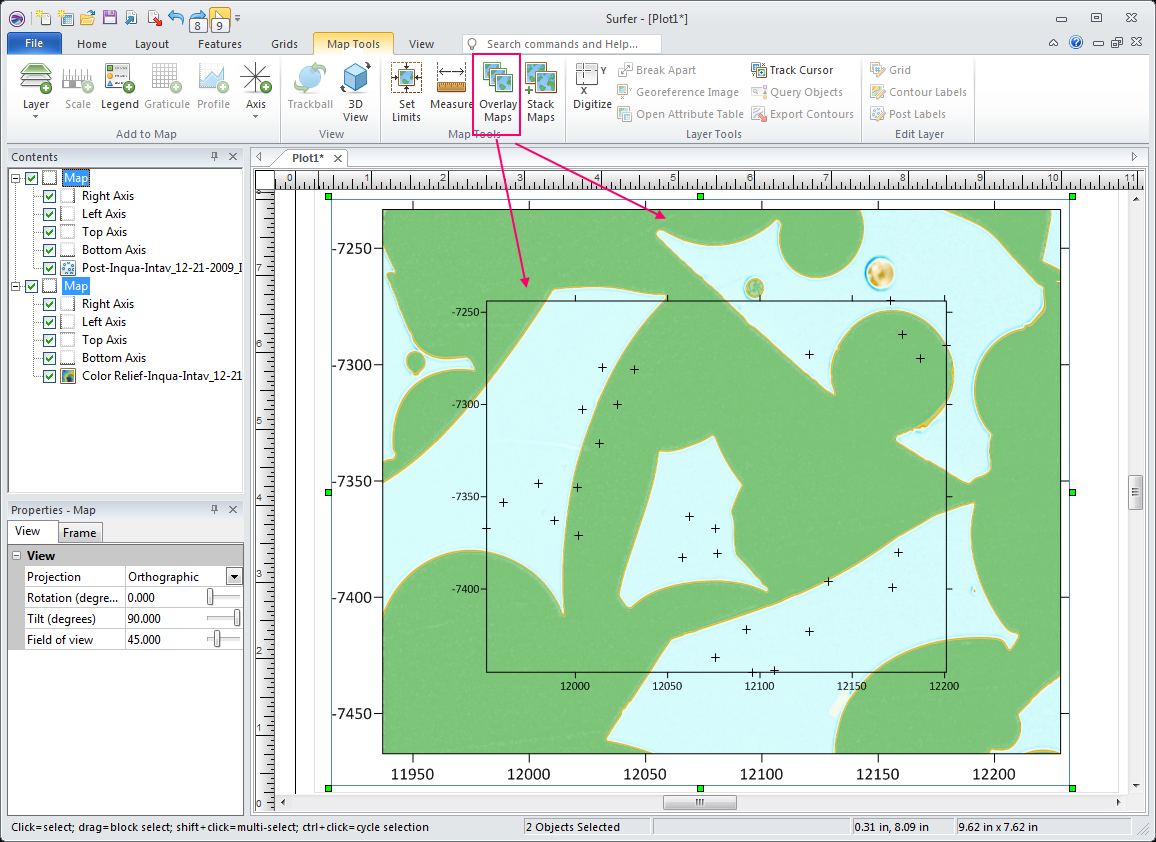
However, we notice that the point symbols are not aligned to the color relief image stage coordinates, so we need to select both the post layer by clicking it, and also the color relief image using <shift> click, and then click the Map Tools tab and then click the Overlay Maps icon as seen above. Once we do that our image and data points share the same coordinate system and we can start customizing them. First let's change the data point symbols from crosses to circles as seen here:
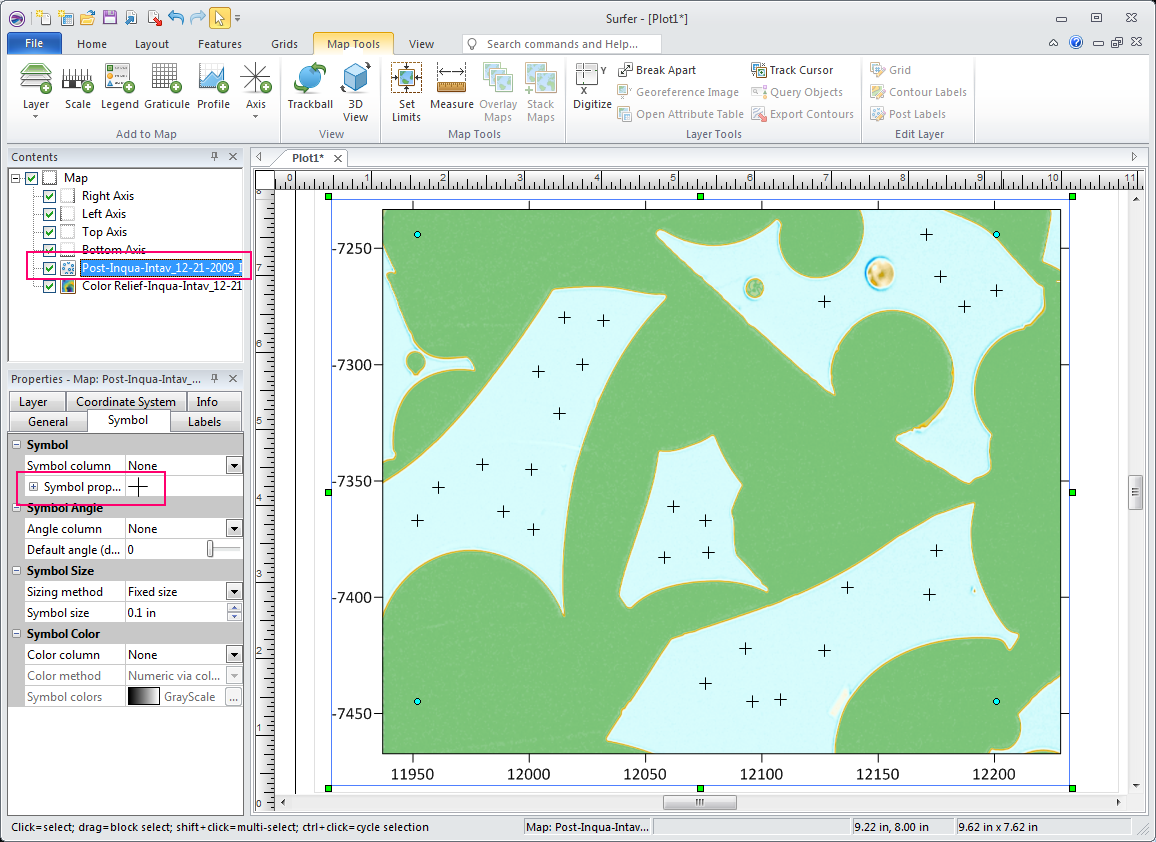
So now our map looks like this:

So now let's add some data point labels as shown here:
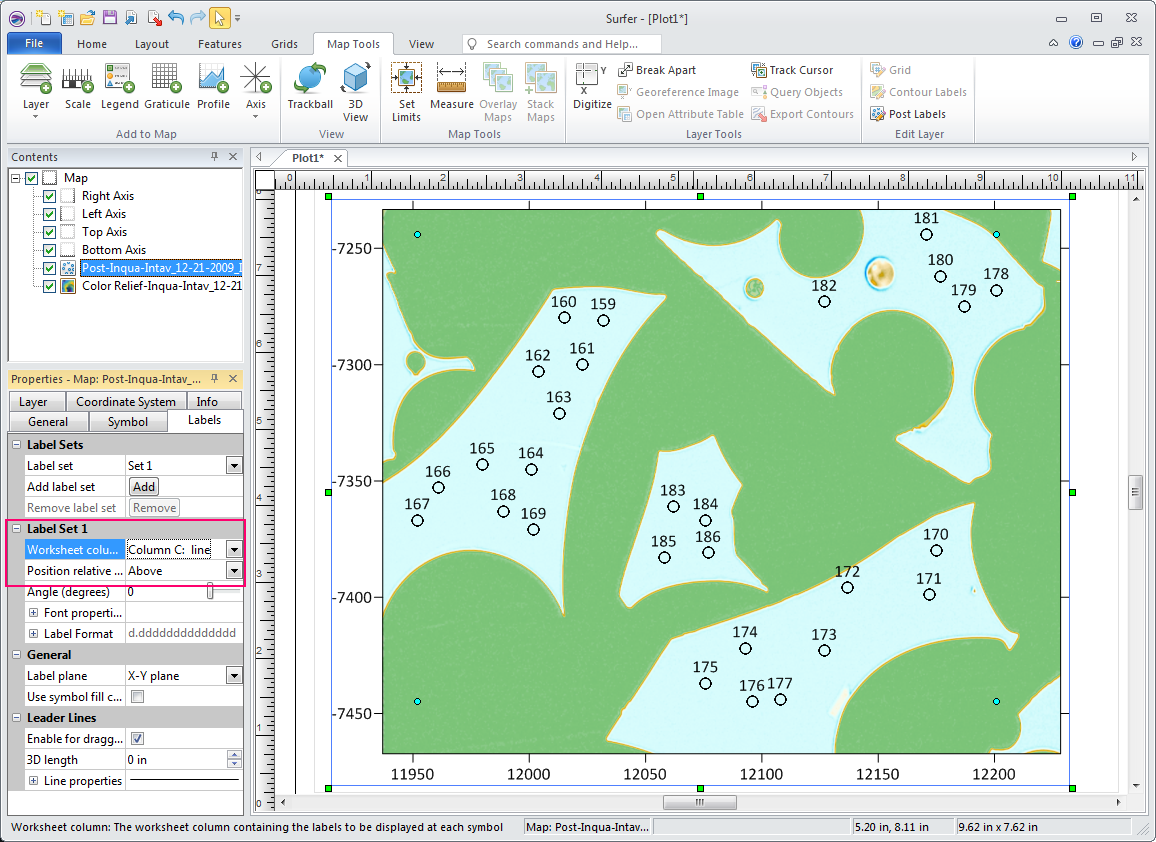
In this case we simply selected the .DAT file output from Probe for EPMA along with our image so we are simply displaying the data point line numbers. But note that this .DAT file could be any tab delimited (or Excel) file containing our X, Y stage coordinates and other data columns which can be also output from Probe for EPMA.


 We depend on your feedback and ideas!