Recently I've been developing a method for measuring a slew of trace elements in ilmenites and sulfides and I need some help with what appear to be spectral artifacts in my measurements. The customer wanted the following trace elements measured:
pt ma pd la ga ka ag la au la v ka lu la f ka hf la cr ka as ka nb la ta ma zr laWhich is a just fine, but we also need to measure the major elements to deal with possible interferences from Fe, Ti, S, Cu and while we're at it probably Si, Ca, Al, etc. as well. So I decided to measure the remaining elements using our Thermo Pathfinder EDS system, because measuring 14 trace elements on 5 spectrometers is time consuming enough as it is! So we measured a full EDS spectrum in PFE along with the WDS trace elements. This allows us to correct for interferences on the WDS trace elements using the (major/minor) element concentrations determined from our EDS spectra.
All fine and good. Though a quick reminder, when one has this many elements by EDS and lots of points, it's really important to note this feature for utilizing "stored" EDS net intensities, in order to speed the quant calculations up considerably:
https://probesoftware.com/smf/index.php?topic=40.msg8637#msg8637Anywho, during the method development I acquired some high precision wavescans on of their ilmentites and noticed this odd "peak" in the Hf La region on an LiF crystal:
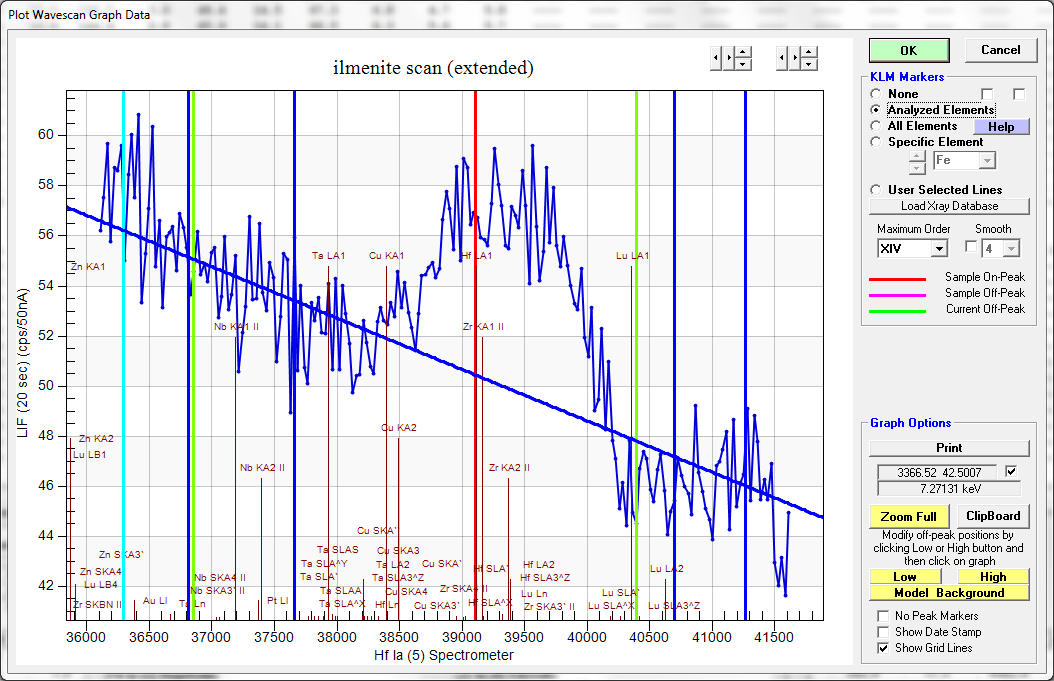
You can see (most) of the MPB (multi point background) measurement positions that I decided to utilize for this effort. But the thing is this peak is *way* too wide to be a normal spectral emission peak and I have no idea what it is, but it creates an "interference" of around 0.3 wt% Hf in pure iron metal.
Then last night I extended the range a bit more to see the remaining MPB position and increased the acquisition time for better precision and now we see this:
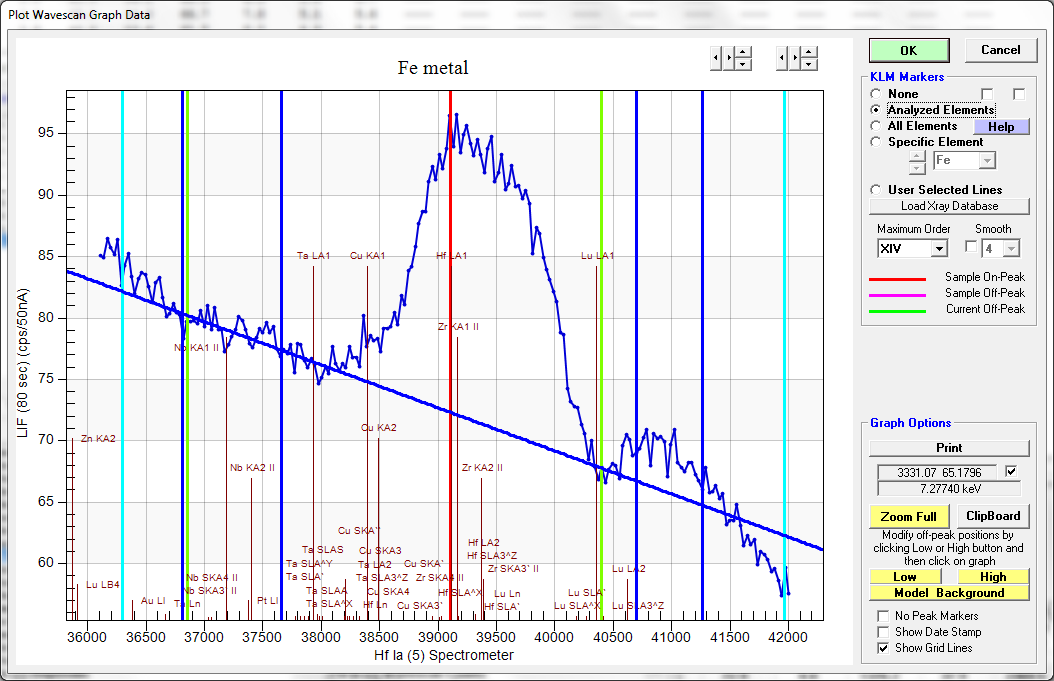
So what the heck is this "peak"? Has any body seen this on their instruments/crystals?


 You cannot see "members only" boards if you are not a member, so please join the forum!