Hi Frank,
This is exactly the right way to do this. Sometimes people try to save time by defocusing the beam while scanning the stage but that only creates systematic errors for light elements as described in the M&M poster attached to the post linked here:
http://probesoftware.com/smf/index.php?topic=44.0Yes, you should be able acquire arbitrary points or grids of points in PFE and acquire them as described here:
http://probesoftware.com/smf/index.php?topic=60.0and perform modal analysis on the quantitative compositional results as described here:
http://probesoftware.com/smf/index.php?topic=41.msg254#msg254You can also of course acquire beam or (preferred) stage scans over whatever areas and quant, filter and export them in CalcImage and finally average the results in Excel. This last method I will describe in more detail here...
We start with a compositional map of one of our CalcImage Mt St Helens samples as seen here:
http://probesoftware.com/smf/index.php?topic=41.msg195#msg195Quantification using PFE, PI and CalcImage is described here:
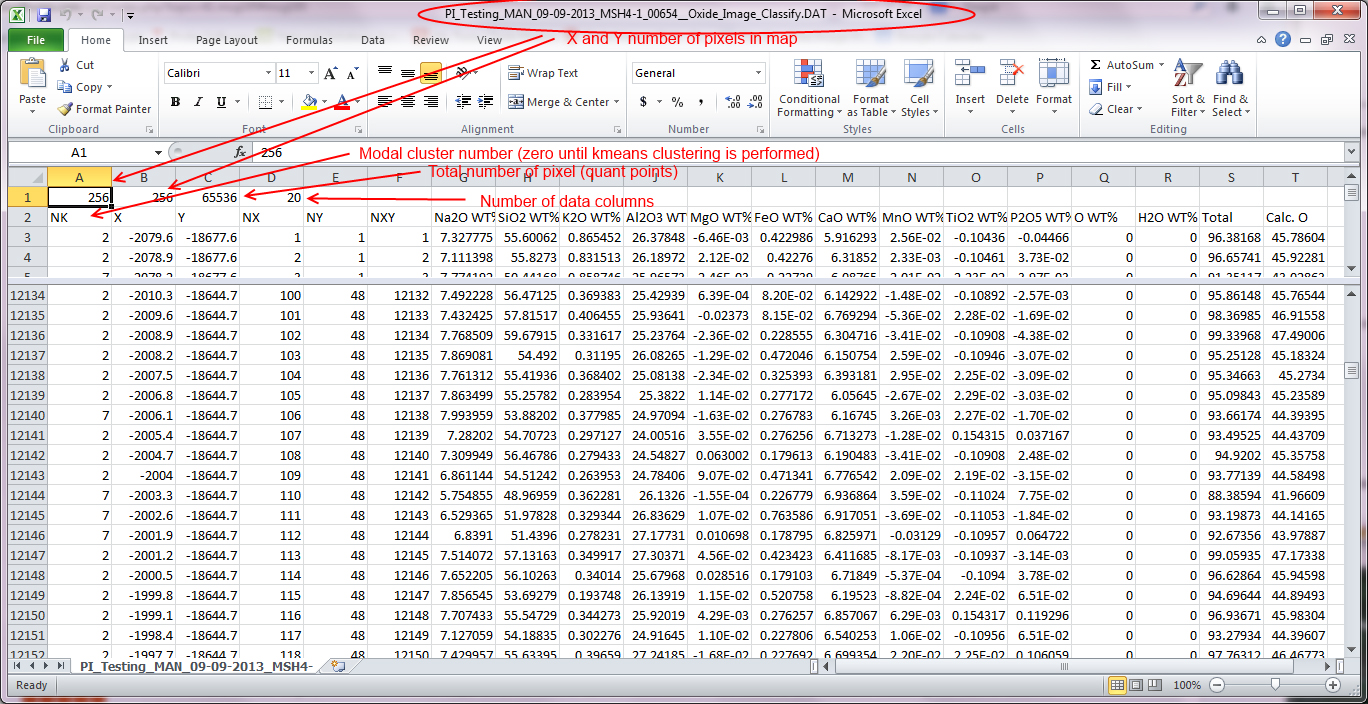
http://probesoftware.com/smf/index.php?topic=146.0Now the easy thing is that once CalcImage has finished the quantification, it automatically outputs a tab delimited .DAT that can be easily imported into Excel as seen here with some explanation of the column labels (see the CalcImage.pdf for complete details):
Note that all quant map data types (elemental, atomic, formula, oxide, end-members, etc) are output if selected as described here:
http://probesoftware.com/smf/index.php?topic=41.msg195#msg195and other posts in that topic.
And once you are in Excel you can average the data any way you like!
And finally one can also perform horizontal and/or vertical "strip averaging" on any x-ray maps as shown here:
http://probesoftware.com/smf/index.php?topic=41.msg897#msg897Ok, one more thing... you can also average arbitrary polygon areas to obtain average and variance of the quantitative pixels as described here:
http://probesoftware.com/smf/index.php?topic=41.msg543#msg543


 All Electron Probe Micro-Analysts are welcome to register and post!