Hi Tom,
If what you are really after is the ratio of phases in a sample, then Jeff is correct. XRD is usually the way to go.
As for elemental composition, even other bulk methods such as XRF, which has a much larger interaction volume than electron beam methods, one usually grinds the sample into a fine power or dissolves it in a flux to get the average composition.
The problem with electron beam methods for fine grained materials is that when the grain size is somewhat smaller than the beam interaction volume, then as Chuck Fiori used to say: "all bets are off". This is because the x-rays from the emission volume will not have interacted completely or even at all with the other phase compositions. Note that I changed the term to emission volume rather than interaction volume, because what really matters is the volume from which the x-rays are emitted. We really don't care what happens below the emission depth (except for cases of substrate fluorescence, like trying to measure phosphorus in a film on a Si substrate!).
But also note that high energy x-rays tend to come from deeper in the sample, while lower energy x-rays tend to come from closer to the surface. So we have a sampling issue as well, if we don't ask where our x-rays coming from. Of course the overvoltage matters too because at low overvoltages, even high energy x-rays will tend to come from only the surface as well (hence the rationale for Cameca's "Shallow Probe" instrument). So it's a mix of beam energy, emission energy and overvoltage that needs to be considered.
Think of it like this: in a homogeneous interaction volume we have "bulk" matrix physics and we can apply normal matrix corrections to our measured x-ray intensities. At the other extreme, if our grain sizes are very small compared to our interaction/emission volume (say approaching atomic scale), then every x-ray tends to interact with every phase composition, and we again approach the situation of bulk matrix physics. And in between, well, it's in between physics!

The worst case of course is an interaction volume with two phases.
This is why we utilize particle or thin film geometry corrections when analyzing particles or thin films. Applying bulk matrix corrections to heterogeneous volumes will produce significant errors. Basically we will get a different answer depending on the beam energies involved.
Because of these geometry effects, if one does want an average composition of different phases, then one needs to quant at the finest scale possible, then quant each pixel/point, and only *then*, average the results to get an average composition:
http://probesoftware.com/smf/index.php?topic=198.msg896#msg896Let's consider the situation of an interaction/emission volume at a phase boundary:
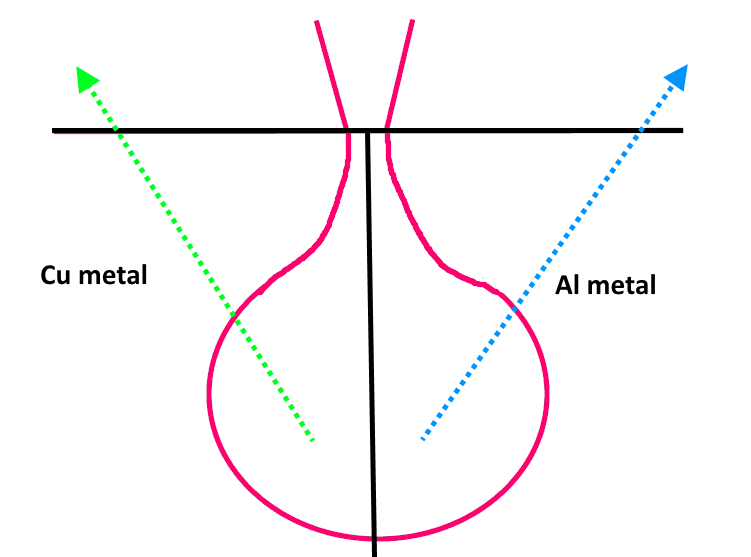
Here we have a boundary between pure Cu and pure Al with the electron beam sitting at the boundary. Note that depending on the detector orientation relative to the sample we could have the emitted Cu Ka x-rays absorbed only by Cu, but in other orientations we will have Cu Ka x-rays absorbed by both Cu and Al. Conversely for Al ka, in some detector orientations we will have Al Ka x-rays absorbed by only Al, but in other detector orientations we will have Al Ka x-rays absorbed by both Al and Cu. And everything in between for in between orientations!
It gets worse. What does our detector see in any detector orientation? We see lots of Cu Ka x-rays, and also lots of Al ka x-rays. So our detector thinks it's seeing Cu-Al *alloy*! But again, some emitted/detected x-rays are only absorbed by one of the phases. And remember, the matrix correction for pure Cu Ka in Cu is 1.0 (relative to a pure Cu standard), and for Al Ka in pure Al it's also 1.0 (again relative to a pure Al standard).
And while the matrix correction for Cu Ka in a Cu-Al alloy is close to 1.0 (it's about a 10% correction in a 50:50 composition), the matrix correction for Ak Ka in a Cu-Al alloy is around 50% (actually 60% in a 50:50 Cu-Al alloy). So our bulk matrix correction happily churns out a composition that totals 150% or so. Of course if one isn't using standards (shudder), then one sees a 100% total and it all looks just fine!
This by the way is often the reason we often see high totals in EPMA as our point traverses cross phases boundaries. Because in a heterogeneous volume at a phase boundary, the application of bulk physics often over estimates our matrix corrections. Of course it could go either way depending on the physics details, but because absorption usually dominates and each phase by itself might be "simpler" physics than a "mix" of the two phases, it's often a high total that we see.
Here's a question to consider: in what detector orientation (relative to a phase boundary) will the emitted Cu and Al x-rays be absorbed *only* in their own respective phases?
If you download the CalcZAf utility:
http://probesoftware.com/smf/index.php?topic=81.0You can get a better idea of the issues involved, especially see the Run | Calculate Electron and Xray Ranges dialog.
This is probably more information than you needed, but let us know what exactly you are trying to accomplish and we can fine tune our responses.
john


 We are a community of analysts, that cares about EPMA