Author Topic: Quantitative Spectral Interference Corrections  (Read 13073 times)

John Donovan

  • Administrator
  • Emeritus
  • *****
  • Posts: 3268
  • Other duties as assigned...
    • Probe Software
Quantitative Spectral Interference Corrections
« on: October 05, 2013, 07:21:00 PM »
One very nice feature of Probe for EPMA is the ability to toggle on and off (globally for a run), a large number of various analytical corrections, without the need to un-assign and re-assign each correction to every sample in a run. For example, from the Analytical | Analysis Options menu dialog we can turn off the quantitative interface correction by simply unchecking the box shown here:


This of course results in a high total since the many interferences that are specified for this sample are ignored when the Use Assigned Interference Corrections On Standards and Unknowns checkbox is unchecked as seen here: (it is automatically selected for you, whenever you assign a new spectral interference).


Though we could simply return to full interference corrections by simply checking the above checkbox, let us instead, add a new interference assignment which, as noted above, will then select the Use Assigned Interference Corrections... checkbox, automatically.

While the quantitative interference corrections in Probe for EPMA are extremely accurate and easy to use there are some pitfalls awaiting the unwary user (including "yours truly" on more than one occasion!).  Let's start by assigning a well known interference usually observed in monazite compositions that is critical for U-Th-Pb chemical age calculations: Y LG3 on Pb Ma. We begin by opening the Standard Assignments dialog from the Analyze! window as seen here:


Note however, that the All Samples option is selected in the Analyze! window (and then the Select All button clicked to select all samples in the run).  This ensures that the program automatically assigns the interference correction to all standards and unknowns in the run.

If we had previously observed a non-zero, but still significant concentration of Pb that we did not expect in a sample containing a major amount of Y, say a Yttrium Aluminum Garent (YAG) standard, we might suspect that this is indeed an interference as opposed to a contaminant, but how can we confirm this? One way is to click the Pb element row since that is the element that is suspected to being interfered with, and then click the Calculate Interferences button as seen here to confirm if the interference is even possible. This calculation merely assumes Gaussian peak shapes and calculates the nominal spectral overlap one might expect to observe. If the suspected interference does not show up in the list of possible interferences, we might then consider contamination rather than spectral interference as the culprit.


But as can see in the above screen capture, the Y LG3 line is indeed listed, so we now know that the interference is most likely actually present. So normally, we would just assign the YAG standard as the standard for the interference, but here is where it gets a bit interesting. In Probe for EPMA, we only need to note: the element being interfered with, the element causing the interference, the order of the x-ray line that is causing the interference and a standard to be used for the interference that should ideally contain a major amount of the element causing the interference and none of the interfered element- and (this is important), no other elements causing an interference on the interfered element.

Therefore, although a YAG standard would normally suffice as an interference standard for Y on Pb because Probe for EPMA automatically accounts for the difference in the matrix between the unknown and the standard used for the interference (see Donovan, et al. attachment below), it does *not* account for peak shifts due to chemical states in the interference correction (at least not yet!). And as noted by Mike Jercinovic a few years ago (see Jercinovic and Williams attachment below), the peak position of the Y LG3 line is sensitive to chemical states and therefore one must choose another standard for the interference correction. Fortunately we can assign a YPO4 standard because it does not contain any Pb as shown here:


However, the clever observer will also note the interference of La La1 (II means 2nd order) on Pb listed just below the Y LG3 interference which is even slightly larger. Unfortunately on this occasion, the LaPO4 standard *does* contain a small amount of Pb and therefore is unsuitable as an interference standard for La on Pb, although a Pb free LaPO4, LaB6 or LaF3 standard could be utilized.

The end result of all the interference corrections assigned is shown here, which results in a much better total than previously:


Finally, if we like to note the magnitude of the interferences on each element, we can see them listed in the log window as shown here:


Thank-you to Julien Allaz who made me aware of the Y LG3 peak shift issue between YAG and YPO4.
« Last Edit: September 30, 2016, 11:53:26 AM by John Donovan »
John J. Donovan, Pres. 
(541) 343-3400

"Not Absolutely Certain, Yet Reliable"

Probeman

  • Emeritus
  • *****
  • Posts: 2831
  • Never sleeps...
    • John Donovan
Re: Quantitative Spectral Interference Corrections
« Reply #1 on: April 29, 2014, 01:48:32 PM »
Here is the critical page from the paper showing how the  fully quantitative interference correction is derived:

« Last Edit: April 29, 2014, 04:10:56 PM by Probeman »
The only stupid question is the one not asked!

JohnF

  • Professor
  • ****
  • Posts: 105
  • CQ DX DE WA3BTA
    • John's EPMA
Re: Quantitative Spectral Interference Corrections
« Reply #2 on: November 12, 2017, 04:54:19 PM »
Yesterday I had a frustrated morning as I couldn't get PfE to correct an overlap.
Let me explain: We are studying Fe-Ni compounds using low (7) kV, and experimenting with the use of the La and Ll lines, and testing different crystals of different spectrometers. This complication was the source of my confusion.
Ni La on LTAP
Ni La on PC1
Ni La on PC0
Ni Ll on LTAP
Ni Ll on PC1
Ni Ll on PC0
Fe La on LTAP
Fe La on PC1
Fe La on PC0
Fe Ll on LTAP
Fe Ll on PC1
Fe Ll on PC0

Got that? All being run on each standard and unknown.

Eventually based upon the wavescans, the decision came down to using the Ll lines on PC0.

However, on the PC0 the Fe La (actually Lb, as they are merged together on the PC0) has a major overlap upon the Ni Ll.

Now in the interference correction in PfE, John Donovan doesn't only show the element interfering with the studied element, he lists the x-ray line. That is what confused me.

Add: to run the quant, I had to D! (disable quant) on the 4 "other" lines.

Since the PC0 Fe La (short for La/Lb) overlapped the PC0 Ni Ll, I selected PC0 Fe La as the interfering line....but Pf'E refused to run the quant. After some consultation with John, and more scratching my head, I did something that seemed illogical, but worked....I put the interfering line as the PC0 Fe L1...and the quant worked! Then I realized that I was focusing on the wrong thing, the _line_ rather than the _element_.


John Donovan

  • Administrator
  • Emeritus
  • *****
  • Posts: 3268
  • Other duties as assigned...
    • Probe Software
Re: Quantitative Spectral Interference Corrections
« Reply #3 on: November 12, 2017, 05:38:22 PM »
Since the PC0 Fe La (short for La/Lb) overlapped the PC0 Ni Ll, I selected PC0 Fe La as the interfering line....but Pf'E refused to run the quant. After some consultation with John, and more scratching my head, I did something that seemed illogical, but worked....I put the interfering line as the PC0 Fe L1...and the quant worked! Then I realized that I was focusing on the wrong thing, the _line_ rather than the _element_.

Hi John,
Complex example, but very cool!

Sorry for the confusion but I add the x-ray line to the Elements/Cations interfering element listbox, when an element is duplicated.  It really just serves as an identifier for the element channel in the software.  I could just as well say Fe (1), Fe (2), Fe(3), etc.  But more often people (like you) are comparing the performance of different lines for the same element, and in these cases the x-ray line string helps to identify the quantitative element channel.

And because the interference correction in PFE is completely quantitative, it doesn't matter what emission line we are utilizing for the interfering element, it only matters what the *concentration* of the interfering element is.   So depending on the accuracy of the interfering element quant, one should be able to obtain an accurate interference correction by simply assigning an interfering element channel that isn't disabled for quant.

It gets complicated doing what you do!  You should plot an example of this nasty but intertesting interference correction.  Very cool stuff you and Moy are doing.
john
« Last Edit: November 12, 2017, 05:50:59 PM by John Donovan »
John J. Donovan, Pres. 
(541) 343-3400

"Not Absolutely Certain, Yet Reliable"

Probeman

  • Emeritus
  • *****
  • Posts: 2831
  • Never sleeps...
    • John Donovan
Re: Quantitative Spectral Interference Corrections
« Reply #4 on: November 14, 2017, 11:38:23 AM »
Hi John,
I really haven't looked into the Fe and Ni La vs. Ll situation as you have, but does it make any sense to try acquiring the La emission lines using the integrated intensity acquisition option where the software performs a scan over the peak to get the intensity for quantification?

I know the integrated intensity scan method works for chemical shift issues with sulfur, but of course the La region is more complex.

http://probesoftware.com/smf/index.php?topic=733.msg4660#msg4660

john
The only stupid question is the one not asked!

Probeman

  • Emeritus
  • *****
  • Posts: 2831
  • Never sleeps...
    • John Donovan
Re: Quantitative Spectral Interference Corrections
« Reply #5 on: December 30, 2022, 12:49:39 PM »
I was recently chatting with a colleague and we were lamenting the situation where we sometimes encounter a user who just hasn't kept up with the EPMA literature.  In this case it's the quantitative spectral interference correction in Probe for EPMA which has been implemented since the 1990s! For details see this paper published in 1993 (the pdf is attached below):

J. J. Donovan, D. A. Snyder and M. L. Rivers, "An Improved Interference Correction for Trace Element Analysis" Microbeam Analysis, 2: 23-28, 1993

Of course it doesn't help that these older issues of Microbeam Analysis do not show up in searches of Google Scholar! Therefore it's important to keep in mind that some science did occur before the Internet was invented!   ::)

But for those who learned about EPMA in the 1990's from say, people who may have learned EPMA in the 1970s or 1980s, this can be of concern... because apparently some people are unaware that one can indeed quantitatively correct for spectral interferences in EPMA.

So I thought I would start with the example that had been raised by a user who claimed "you can't analyze for minor/trace vanadium in titanium bearing minerals", e.g., ilmenites. 

Now we're just looking at standards here today, since we can be sure we know what their actual vanadium contents are (though these interference corrections work equally well on unknown samples), but since I didn't have an ilmenite standard handy, I used an SrTiO3 standard as a proxy. So after tuning up with Ti metal, V metal and SrTiO3 for Ti Ka, V Ka and Sr La respectively, we next perform wavescans on each standard just to observe the spectra in this region:


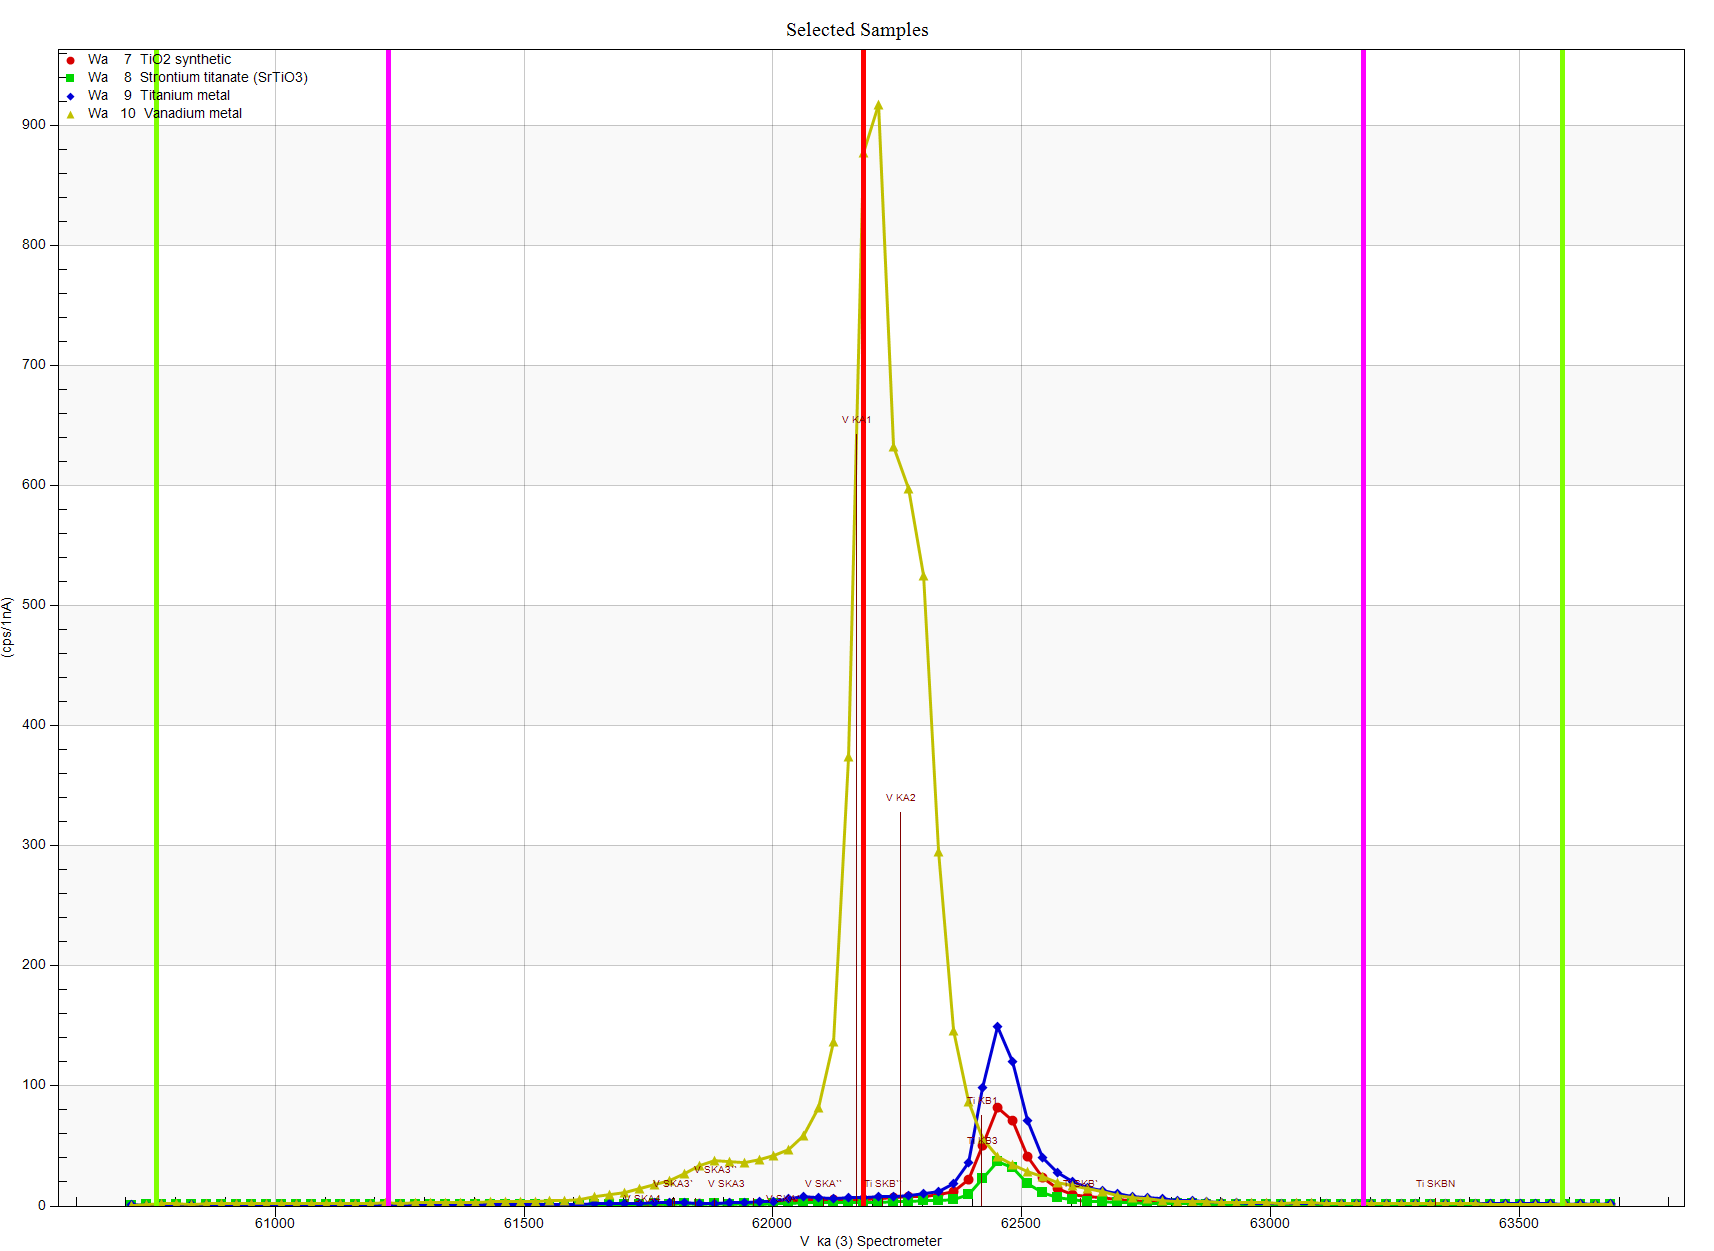
Clearly the extended tail of the Ti Kb line is interfering with the V Ka line as expected. Zooming in to see the background situation more closely we see this:


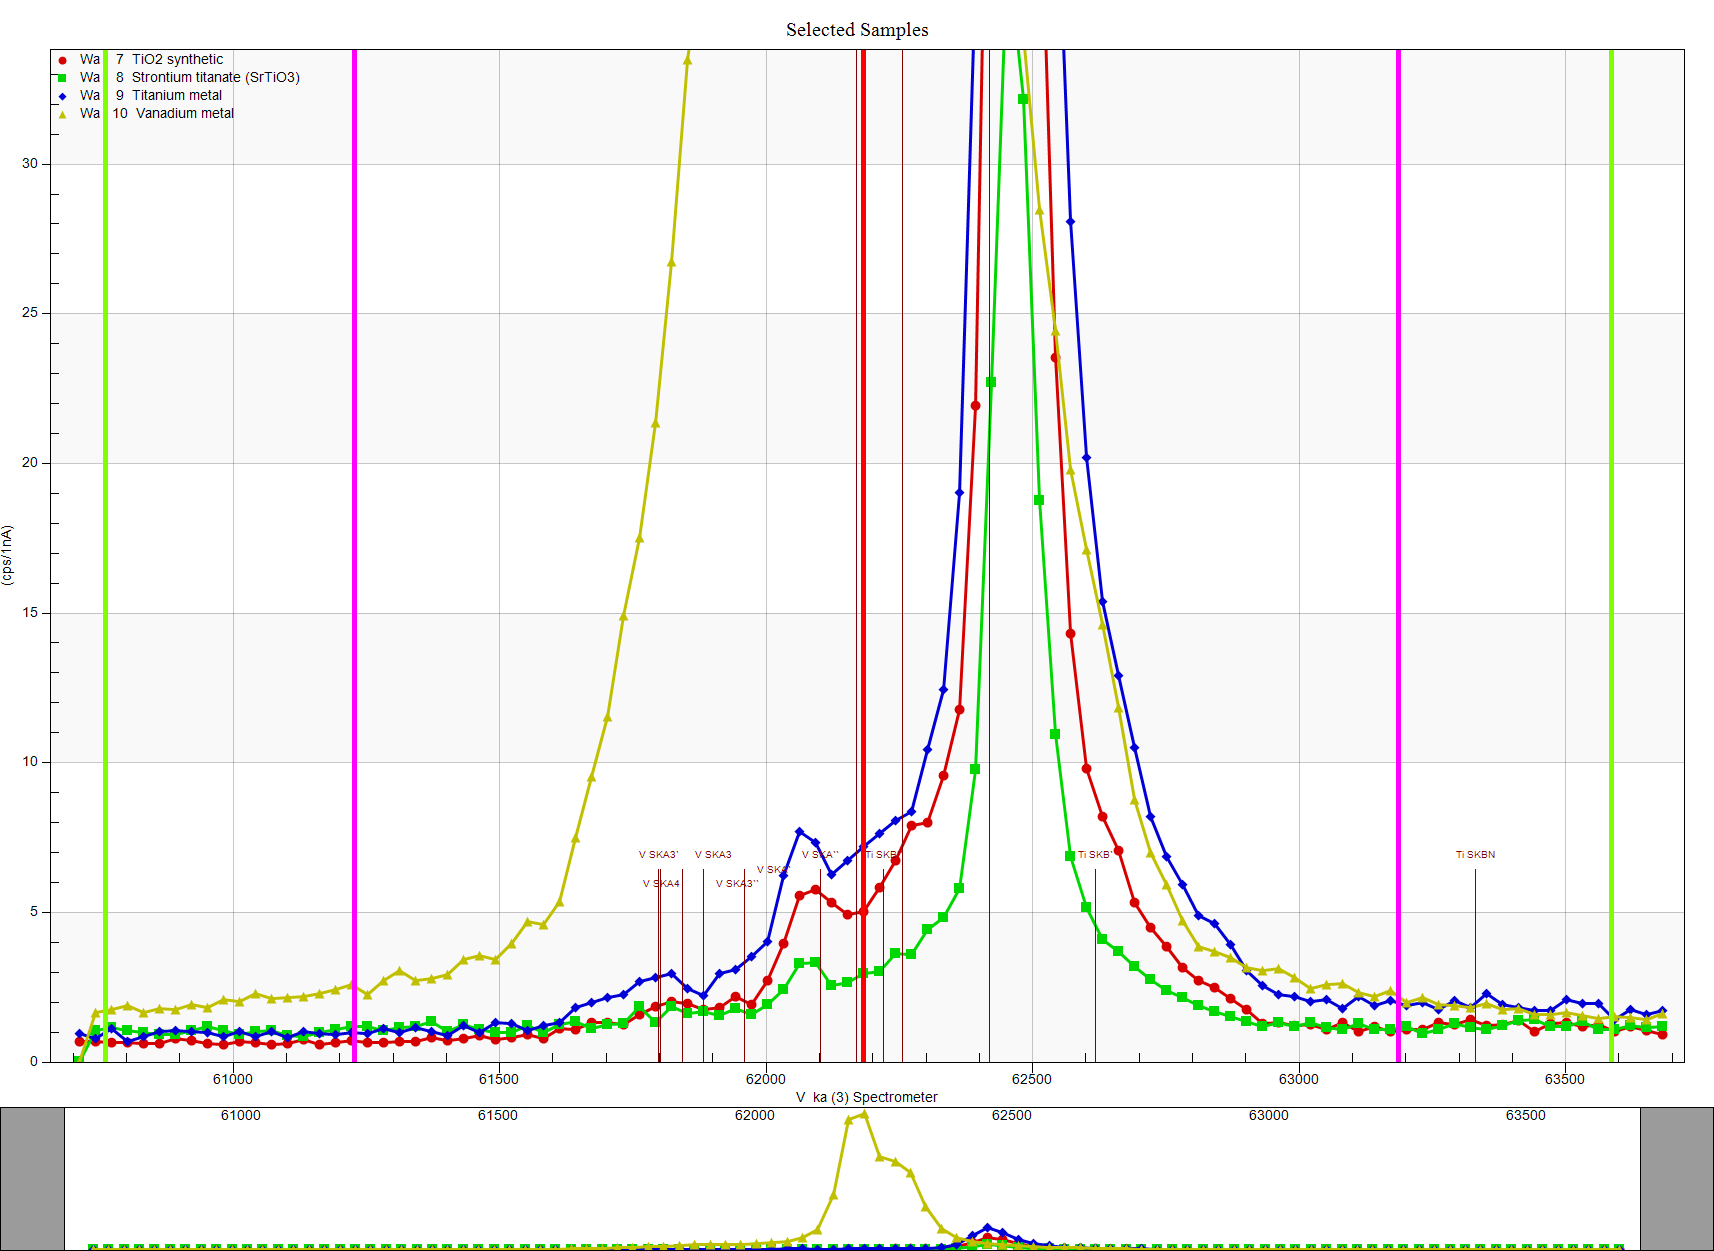
Note that the default positions for the high and low off-peak positions (magenta vertical lines) have been adjusted to be further away (green vertical lines) from the "tails" of the emission peaks. These tails of course are due to polygonization treatment of the Bragg crystals after bending and plastic deformation in order to improve reflectivity. See here for more details on this:

https://probesoftware.com/smf/index.php?topic=79.msg7818#msg7818

This adjustment of the backgrounds is quite important for trace elements when a large interference is present, because we are essentially going to be subtracting two large numbers from each other to obtain a small number. That reminds me to also mention another option in PFE to be sure that one is measuring the interference calibration with the same sensitivity as used for the unknown sample, as shown here:


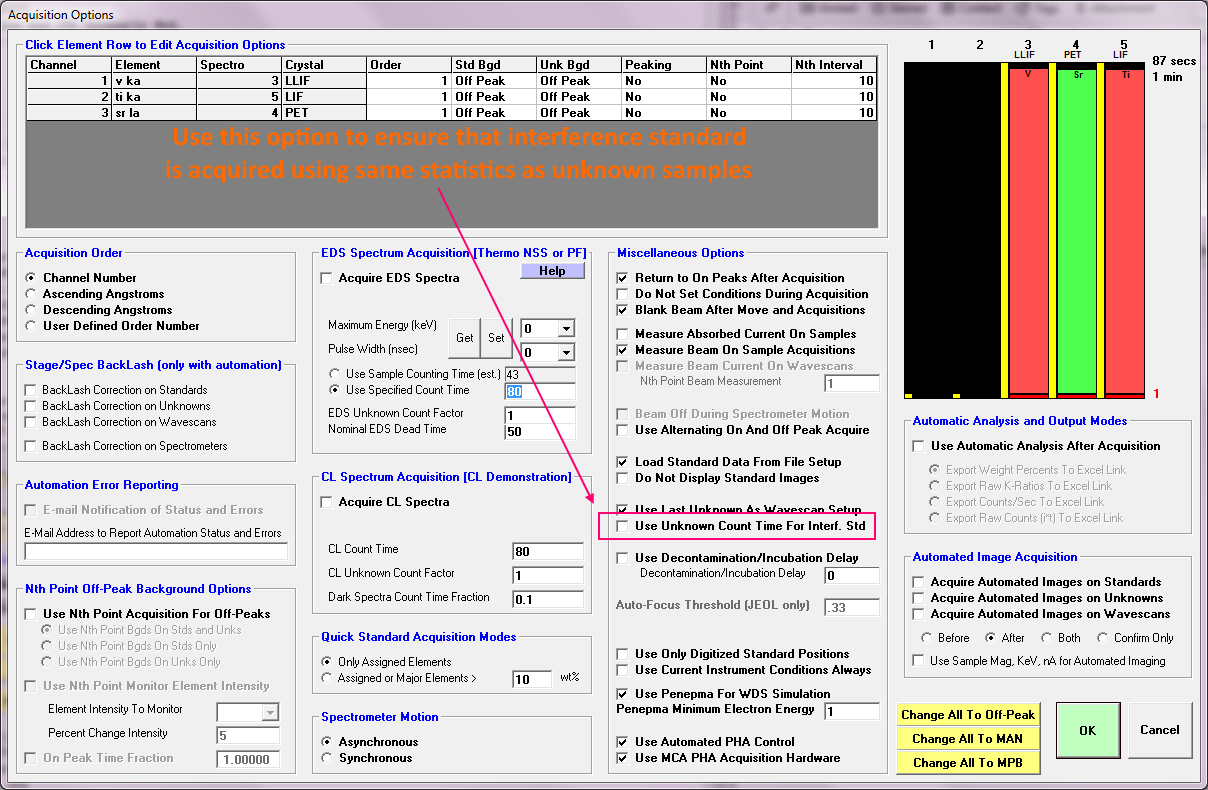
And remember, for the quantitative interference correction, we must measure *both* the interfered emission line, and also the interfering emission line. Furthermore, we must use a standard for the interference correction calibration that contains a known amount of the interfering element (Ti) and *none* of the interfered element (V).  So we must measure at least V Ka and Ti Ka and can use TiO2 as a standard for the interference calibration, assuming it has no V as a contaminant.

So, let's first see what the magnitude of this interference is quantitatively without an interference correction when measuring V in TiO2:

ELEM:        V      Ti      Sr       O   SUM 
   855    .476  59.984   -.002  40.050 100.507
   856    .468  59.860   -.006  40.050 100.372
   857    .475  59.737   -.015  40.050 100.248
   858    .489  60.108    .008  40.050 100.654
   859    .484  59.878   -.029  40.050 100.383

AVER:     .478  59.913   -.009  40.050 100.433
SDEV:     .008    .139    .014    .000    .154
SERR:     .004    .062    .006    .000
%RSD:     1.74     .23 -155.15     .00

PUBL:     n.a.  59.939    n.a.  40.050  99.989
%VAR:      ---  (-.04)     ---     .00
DIFF:      ---  (-.03)     ---    .000
STDS:      523      22     251     ---

So almost 5000 PPM, which is pretty bad, right?  Now we apply the interference correction in PFE from the Standard Assignments dialog as seen here:


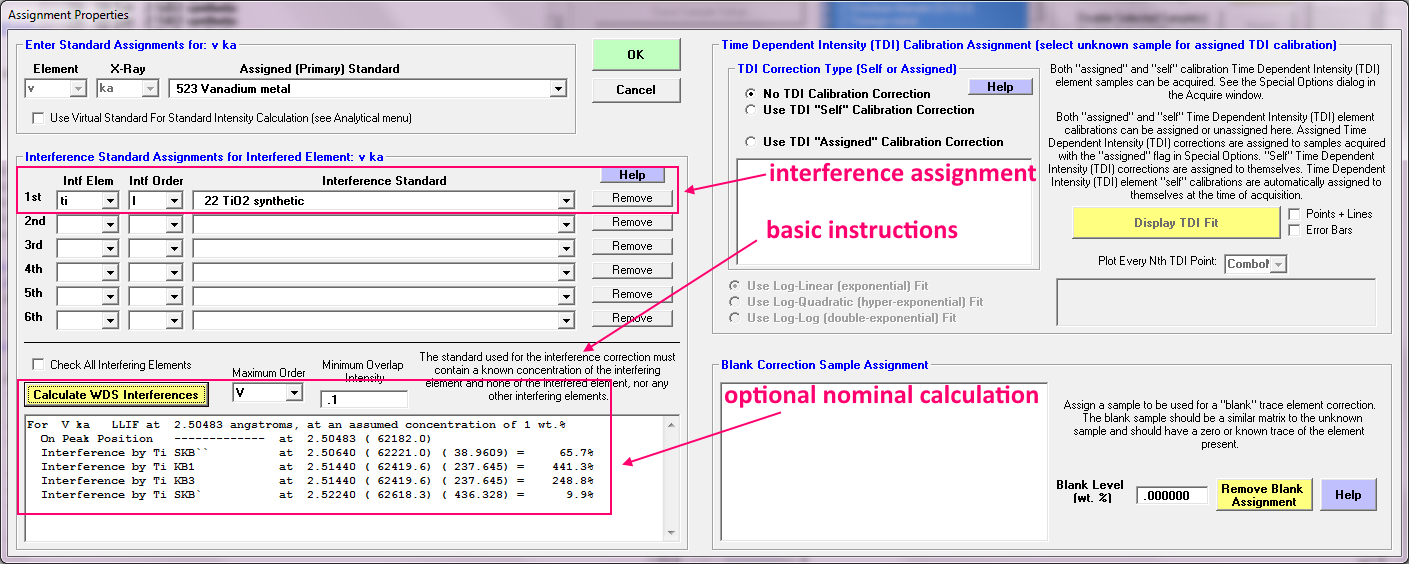
The actual interference assignment is in the upper red rectangle, the optional nominal calculation assuming a Gaussian peak shape is in the lower red rectangle and used only to decide if the apparent interference is due to an actual interference or merely contamination in the standard.

With the interference correction applied we obtain this value for V Ka in TiO2:

ELEM:        V      Ti      Sr       O   SUM 
   855   -.003  60.008   -.002  40.050 100.052
   856   -.010  59.884   -.006  40.050  99.918
   857   -.001  59.761   -.015  40.050  99.795
   858    .009  60.132    .008  40.050 100.199
   859    .006  59.902   -.029  40.050  99.929

AVER:     .000  59.937   -.009  40.050  99.978
SDEV:     .008    .139    .014    .000    .153
SERR:     .003    .062    .006    .000
%RSD:     ----     .23 -155.15     .00

PUBL:     n.a.  59.939    n.a.  40.050  99.989
%VAR:      ---   (.00)     ---     .00
DIFF:      ---   (.00)     ---    .000
STDS:      523      22     251     ---

Now our apparent V concentration is of course zero, simply because this is the standard utilized for the interference calibration.  Now let's apply this same interference calibration to a sample with a very different matrix, SrTiO3, first without an interference correction:

ELEM:        V      Ti      Sr       O   SUM 
   830    .199  26.105  47.632  26.154 100.090
   831    .205  26.169  47.918  26.154 100.446
   832    .207  26.253  47.718  26.154 100.332
   833    .207  26.262  47.751  26.154 100.375
   834    .206  26.371  47.789  26.154 100.520

AVER:     .205  26.232  47.762  26.154 100.352
SDEV:     .003    .101    .105    .000    .163
SERR:     .001    .045    .047    .000
%RSD:     1.54     .38     .22     .00

So an apparent vanadium concentration of ~2000 PPM! And now *with* the interference correction:

ELEM:        V      Ti      Sr       O   SUM 
   830   -.010  26.111  47.618  26.154  99.873
   831   -.005  26.175  47.904  26.154 100.228
   832   -.004  26.259  47.704  26.154 100.113
   833   -.003  26.268  47.737  26.154 100.156
   834   -.006  26.377  47.775  26.154 100.300

AVER:    -.005  26.238  47.747  26.154 100.134
SDEV:     .003    .101    .105    .000    .162
SERR:     .001    .045    .047    .000
%RSD:   -50.13     .38     .22     .00

PUBL:     n.a.  26.103  47.742  26.154  99.999
%VAR:      ---     .52   (.01)     .00
DIFF:      ---    .135   (.01)    .000
STDS:      523      22     251     ---

Now our apparent vanadium content is around -50 PPM which is a slight over correction, but still within 2 sigma (60 PPM) of zero, so we cannot really say that this is statistically significant with 99% confidence. In fact the 99% confidence detection limit for this vanadium in this matrix is around 140 PPM!

Actually I'm pretty sure that this -50 PPM offset from zero is due to the fact that I (unthinkingly) tuned up Ti Ka on Ti metal, and we are looking at Ti oxides, and there is a tiny peak shift from the metal to the oxide. I'll try running it again again, next time tuning up Ti Ka on TiO2 and let you all know how that goes. 

But really when you think about it, -50 PPM is certainly more accurate (closer to zero) than roughly 2000 PPM! And considering that that is about a 4000% correction, it's really not too bad!   ;D
« Last Edit: January 02, 2023, 02:43:37 PM by Probeman »
The only stupid question is the one not asked!

sem-geologist

  • Professor
  • ****
  • Posts: 301
Re: Quantitative Spectral Interference Corrections
« Reply #6 on: January 01, 2023, 07:47:25 AM »
I was recently chatting with a colleague and we were lamenting the situation where we sometimes encounter a user who just hasn't kept up with the EPMA literature.  In this case it's the quantitative spectral interference correction in Probe for EPMA which has been implemented since the 1990s!
Let me join this lamentation with a meme:

I disagree that is only "sometimes". In my experience that is rather a constant uphill battle, in particularly with older generation clients. Somehow young mind is easy to convince. However, unteaching misconceptions (mostly old generation) is much harder endeavour than teaching right concept.
I think the problem often is not lack of knowledge on availability of the interference method itself, but deeply rooted misconceptions with WDS at fundamental part.
Let me list the most bizzare misconcepts to eliminate interferences I had countless times had to debunk:
  • move measurements of interfering element to different spectrometer
  • move measurements of interfering element to different xtal to reduce its intensity
  • move measurement of interfered element to different line (i.e. to beta or different family)
the last point can in some limited cases "work" unless it does not interfere with something else. Also disadvantage is much lowered sensitivity.
The first two points makes me sad as I countless times hear that from people with prof. Sc dr. degree... would it be students I would ask them to reattend the classes on EPMA and pay more close attention, asking prof to do something like that probably would  be very rude. However, more often Students are possible to be corrected once and I don't feel I am wasting my time explaining the concept on site. But some professors... there is hardly words to describe, often I just do the right thing, and don't give them full details, jus nod my head but do as I know is better.

Anyway, i can't imagine any EPMA without interference correction and i use it to its fullest extent (i.e. for REE and HFSE bearing minerals I do about 150 corrections, some are chain interference corrections) as far the Peaksight provides means for it. I know that Peaksight alows that at least from 2005(?), cant remember if unix software had such an option. So much delayed availability of method at vendor software probably also have its part in widespread neglection of this method.

Probeman

  • Emeritus
  • *****
  • Posts: 2831
  • Never sleeps...
    • John Donovan
Re: Quantitative Spectral Interference Corrections
« Reply #7 on: January 01, 2023, 10:13:51 AM »
I was recently chatting with a colleague and we were lamenting the situation where we sometimes encounter a user who just hasn't kept up with the EPMA literature.  In this case it's the quantitative spectral interference correction in Probe for EPMA which has been implemented since the 1990s!
Let me join this lamentation with a meme:

Ha ha, OK, that is cute.

And Happy New Year to you!

I disagree that is only "sometimes". In my experience that is rather a constant uphill battle, in particularly with older generation clients. Somehow young mind is easy to convince. However, unteaching misconceptions (mostly old generation) is much harder endeavour than teaching right concept.

Well, maybe I was being generous a bit in my "sometimes" comment!    :)

But seriously, I agree that students are usually willing to learn, but the problem I think is that (some) faculty, who learned EPMA in past decades, are at a disadvantage mostly because they rarely spend enough time in the lab actually doing work on the instrument.  And then there are those that think they know more about EPMA than the experts...    ::)

Anyway, i can't imagine any EPMA without interference correction and i use it to its fullest extent (i.e. for REE and HFSE bearing minerals I do about 150 corrections, some are chain interference corrections) as far the Peaksight provides means for it. I know that Peaksight alows that at least from 2005(?), cant remember if unix software had such an option. So much delayed availability of method at vendor software probably also have its part in widespread neglection of this method.

Yes, I should have mentioned that PeakSight also includes an interference correction similar to Probe for EPMA (though sadly, the JEOL software does not).  And this last point will only because more problematic as Cameca discontinues selling EPMA instruments while JEOL continues to.

But I have a question about Cameca's implementation of the interference correction: I know that Mike Jercinovic worked with Cameca quite a few years ago to make sure their interference correction was based on the quantitative concentration of the interfering element (along with a matrix correction to extrapolate from the interference standard matrix to the unknown matrix), but did Cameca ever implement an "iterative" approach for their interference correction?

For example, in the case of a "cascade" interference (as shown in the 1993 paper), where one has a Ti-V-Cr alloy where Ti Kb interferes with Va Ka and V Kb interferences with Cr Ka.  I recall the SAMx XMAS software could only handle this situation if the order of the elements in the analysis "list" was in the same order as the "cascade" interference, i.e., Ti -> V -> Cr.  So in the situation of such a "cascade" interference, does the order of the elements in the PeakSight software matter?

In PFE because there is an additional iteration loop for the correction of compositionally dependent corrections (e.g., interferences, APFs, MAN bgds), the interference correction gets applied repeatedly until it converges, so the order of the elements in the software does not matter.  This is described in the 1993 paper attached in my above post.

Worth pointing out also is that an iterative interference approach is often required whenever the interference correction causes a significant enough compositional change in the matrix correction. If that compositional change is large enough (typically in the case of a compositional change greater than a percent or so absolute), then the matrix correction should be re-applied for best accuracy.

It's somewhat similar to the situation of attempting to apply an element by difference or TDI correction externally in Excel without then re-calculating the matrix correction based on the new composition. If the matrix correction is not re-applied, the composition of major elements can be off by several percent relative or so.  E.g., water by difference in hydrous glasses will be off by around 1% absolute!

https://link.springer.com/article/10.1007/s00445-005-0003-z

An even more "pathological" situation is the correction of two analytical lines that interfere with each other!  If the overlap is tiny, a single application of the interference correction might be enough (Ti Ka and Ba La), but in the case of As Ka and Pb La, the iterative interference correction is essential.

  • move measurements of interfering element to different xtal to reduce its intensity

The only time this would make sense is when the other crystal has a smaller d-spacing and therefore better spectral resolution. 

For example in the case of the Ti Kb interference on V Ka, the apparent concentration of the Ti interference on vanadium in ilmenite is only around 0.4% or so using an LIF crystal, but when using a PET crystal the interference is much larger, around a few percent or so.  But as you say, using a higher resolution Bragg crystal doesn't remove the problem, it only reduces the problem!   Darn that Bragg polygonization!    >:(

Kind of similar to attempting to utilize PHA differential mode to eliminate a higher order Brag interference. Differential mode doesn't help at all on same order interferences (e.g., our Ti kb on V Ka interference example above). At most, differential mode might *reduce* a higher order interference. But then one is stuck with all the problems of differential mode, for example non-linear response of the detector when the count rate changes due to pulse height depression. 

As you have correctly pointed out repeatedly and consequently I have now changed the way I do PHA, as I will discuss using the Ti -> V example. For example, we have discussed the importance of properly adjusting the PHA settings for the large change in count rates when performing the "constant k-ratio" method for dead time calibration (over a large range of beam currents), but we also need to consider the large change in count rates when going from a primary standard to a trace element!

https://probesoftware.com/smf/index.php?topic=1466.msg11416#msg11416

In short, better to have a linear detector response, and let all the interferences "come in" and let the quantitative interference correction deal properly with them!   :)
« Last Edit: January 01, 2023, 10:20:06 AM by Probeman »
The only stupid question is the one not asked!

Probeman

  • Emeritus
  • *****
  • Posts: 2831
  • Never sleeps...
    • John Donovan
Re: Quantitative Spectral Interference Corrections
« Reply #8 on: January 02, 2023, 02:42:29 PM »
Actually I'm pretty sure that this -50 PPM offset from zero is due to the fact that I (unthinkingly) tuned up Ti Ka on Ti metal, and we are looking at Ti oxides, and there is a tiny peak shift from the metal to the oxide. I'll try running it again again, next time tuning up Ti Ka on TiO2 and let you all know how that goes. 

Before I discuss my results from re-checking the tuning/settings of the Ti Kb interference of V Ka, I'd like to share my most recent thinking on how to tune one's PHA settings for best quantitative results.  Because these PHA settings are critical not just for the constant k-ratio method, but in any situation when one is going from high to low concentrations, for example trace element quantification.

And before anyone says, well just use a primary standard that is similar in concentration to the unknown, please look at the equations for calculating sensitivity, and realize that for best sensitivity, we need a primary standard with the highest count rate per concentration to obtain the best detection limits.  And that will be either the pure metal or the pure oxide of the element.

And yeah, I know I'm not the "sharpest knife in the drawer", but still it amazes me that it's taken me over 30 years to finally understand how one's PHA settings should be adjusted. I should also thank SEM-Geologist who has provided many helpful suggestions and insights along this process of me better understanding PHA.

First of all (as suggested by SG some time ago), we really should only be using our PHA electronics in *integral* mode. Yes, there may be some very rare situations where one cannot obtain a suitable interference standard for a high order interference where differential mode might be somewhat helpful (Na Ka II on O ka comes to mind), but even there we can only reduce the higher order interference, not eliminate it completely, especially as the PHA peak for oxygen tends to be quite wide.  And of course for all same order interferences, differential mode doesn't help at all, and in fact can contribute to a non-linear response of the detector system.

Therefore, we should in general utilize *integral* PHA mode, and in addition be sure to adjust settings so our PHA peaks fully above the baseline level when observing our highest expected intensity (primary standard), at our highest expected beam current , where pulse height depression effects are greatest. At lower concentrations or lower beam currents (lower count rates), our PHA peaks will indeed shift to the right, but in integral mode, all these photons, even those that appear to be "cut-of" on the right side of our PHA distributions, will *still* be properly counted, as has been demonstrated on Cameca instruments by myself and on JEOL instruments by Anette von der Handt.

So, when I started this Ti Kb on V Ka interference testing last week I loaded an old V Ka element setup from the PFE element setup database and acquired a PHA scan as seen here (vanadium metal at 20 keV):


Now, in the past I might have said, well, lets just lower the baseline to include the whole PHA peak without the escape peak, because one could have argued: either include the whole escape peak or exclude the whole escape peak. But because we know at lower count rates, this peak will shift to the right, we really can't be sure that the escape peak does not start to appear and begin "creeping" above the baseline level.  Not only that, but the PHA is in differential mode as shown by the red double vertical lines.  So the best thing I now I think is to increase the gain and lower the baseline so that the entire escape peak is above the baseline. Here is my first effort at adjusting the PHA peak:


Note the initial appearance of the escape peak by going from gain 573 to gain 1199 and also that we are now in integral mode as shown by the single red vertical line.  But the escape peak is still only partially above the baseline, so here is some more gain:


Now the escape peak is clearly visible and we could just leave it there, but not that the baseline is still a little high as some of that escape peak is being cut off (which will contribute to a non-linearity of the detector response), so I lowered the baseline a bit more and added more again:


So now the baseline looks good, but you might say: hey the counts on the right side of the PHA distribution are being cut off!  But remember, in integral mode, those counts to the right of the visible PHA distribution are *still* being counted, so no worries there!

And it only took me 30 some years to understand this!    :(
« Last Edit: January 04, 2023, 05:39:43 PM by Probeman »
The only stupid question is the one not asked!

sem-geologist

  • Professor
  • ****
  • Posts: 301
Re: Quantitative Spectral Interference Corrections
« Reply #9 on: January 03, 2023, 04:42:56 AM »
But I have a question about Cameca's implementation of the interference correction: I know that Mike Jercinovic worked with Cameca quite a few years ago to make sure their interference correction was based on the quantitative concentration of the interfering element (along with a matrix correction to extrapolate from the interference standard matrix to the unknown matrix), but did Cameca ever implement an "iterative" approach for their interference correction?

For example, in the case of a "cascade" interference (as shown in the 1993 paper), where one has a Ti-V-Cr alloy where Ti Kb interferes with Va Ka and V Kb interferences with Cr Ka.  I recall the SAMx XMAS software could only handle this situation if the order of the elements in the analysis "list" was in the same order as the "cascade" interference, i.e., Ti -> V -> Cr.  So in the situation of such a "cascade" interference, does the order of the elements in the PeakSight software matter?

It is hard to answer the question as working principles are a bit enigmatic (like a black box) and idea how it is working can be intercepted from looking how output from such black box changes while changing input. I rather tend to believe it is iterative as:
1) User Manual tells it works with X-PHI (Merlet) matrix correction (Cameca has two matrix correction models: X-PHI and PAP), would it not work with PAP? I never tried that as I use X-PHI from the start of my carrier. Anyway, this rather points that it is rather iterative if correction model maters for their implementation.
2) With my mentioned ~150 corrections (for REE+HFSE) that extends (matrix) recalculation time enormously, I get impression that time needed for recalculations rises exponentially (albeit that is an impression, not precisely measured) depending from number of correction and what would take only a fraction of second without corrections, takes nearly a minute with corrections.  :o 

As for cascade interference I believe it has some chain-interference recognition mechanism. Its existence is clear from behavior. It will abort all interference corrections if any circularly closed chain is in the definition (does not depend if it is one on one (i.e. Pb_Ma vs S_Ka) or tens of chain correction jumps to get back to the chain starting element). That I believe is one of the major difference, and at first glance a clear disadvantage of PeakSight compared to PFE. However, necessity is mother of all inventions, and thus made me found quite convenient workaround: self-correcting background position(s) - that is background position(s) which will increase the interpolated background under the measured interfered peak with increasing interfering peak intensity in a way that it completely compensate, and correction is not needed. The advantage is that it takes no computing cycles for correction and is able to brake closed chains for interference correction.

An even more "pathological" situation is the correction of two analytical lines that interfere with each other!  If the overlap is tiny, a single application of the interference correction might be enough (Ti Ka and Ba La), but in the case of As Ka and Pb La, the iterative interference correction is essential.

Yes, PeakSight would have problem with this as that is circular chain. Albeit I can think a workaround with mentioned application of self-correcting background positions and slight off measuring the peaks... But why to measure it like that? Would not Pb Ma and As La would be a better way?

  • move measurements of interfering element to different xtal to reduce its intensity

The only time this would make sense is when the other crystal has a smaller d-spacing and therefore better spectral resolution. 

For example in the case of the Ti Kb interference on V Ka, the apparent concentration of the Ti interference on vanadium in ilmenite is only around 0.4% or so using an LIF crystal, but when using a PET crystal the interference is much larger, around a few percent or so.  But as you say, using a higher resolution Bragg crystal doesn't remove the problem, it only reduces the problem!   Darn that Bragg polygonization!    >:(
I think You fail to grasp the severity of my lamentation and mixed the "interfered" with "interfering": :). The two first positions in my bizarre list has interfering (not the interfered) element measurements - that is why I have such an overwhelming urge to send some "learned"-ones back to the class to learn at least the very basics of EPMA (or the basic concept of whole family of this kind of measurements: radiation-source->sample->detection). The fallacy (do I need really to spell this here, is it not obvious?) is as supposedly the interference happens due to measuring the lines on the same spectrometer... so in Ti-V example the fallacy is if we won't measure Ti on same spectrometer (and move it to other) then V will have no interference of Ti - that is an outrageous nonsense. Just try to imagine of explaining that is a nonsense to someone with such a zealous misconception again the nth time... it is kind of depression-concentrate...

However, if it would be interfered element – then yes, (agreeing with you) moving it to different spectrometer/XTAL could make a difference - especially on system with no circular interference corrections allowed. I.e. Ba La and Ti Ka: on (L)PET both overlap one another, on (L)LIF the peaks are less broad and so while Ti Ka (which is sum of Ka1,Ka2 and Ka3) still overlaps Ba La1, Ba La1 does not overlap Ti Ka anymore  thus only single interference correction is needed and circular correction situation is evaded. Ti-V example as You had demonstrated is not resolved by moving it to LIF and still need the correction.

Kind of similar to attempting to utilize PHA differential mode to eliminate a higher order Brag interference. Differential mode doesn't help at all on same order interferences (e.g., our Ti kb on V Ka interference example above). At most, differential mode might *reduce* a higher order interference. But then one is stuck with all the problems of differential mode, for example non-linear response of the detector when the count rate changes due to pulse height depression. 

As you have correctly pointed out repeatedly and consequently I have now changed the way I do PHA, as I will discuss using the Ti -> V example. For example, we have discussed the importance of properly adjusting the PHA settings for the large change in count rates when performing the "constant k-ratio" method for dead time calibration (over a large range of beam currents), but we also need to consider the large change in count rates when going from a primary standard to a trace element!

https://probesoftware.com/smf/index.php?topic=1466.msg11416#msg11416

In short, better to have a linear detector response, and let all the interference "come in" and let the quantitative interference correction deal properly with them!   :)

While I use integral mode everywhere, I still use diff mode for Pb Ma, Th Ma and U Ma in conjunction with interference corrections. All of those are at lower energy than Ar K absorption, and thus there is no Ar esc peak, that simplifies the PHA problem. I want to point out that additionally to diminishing some higher order REE lines, the Diff mode in these cases significantly improves peak-background ratio by limiting also higher order bremsstrahlung background. There is still presence of problem of non-linearity as rejected pulses are not currently included in dead time correction (I mentioned in some older posts, and I got some hint that it will be included in next patch of PeakSight), but even then in these particular corner cases diff mode at low count rates provides more than takes away. Luckily diff mode is more of interest for lower energy X-rays where it is most susceptible with higher order interference and luckily these have no Ar esc pulses thus PHA distribution is simple. With no Ar esc there are some more tricks in the sleeve at disposition (i.e. reducing the bias of detector and increasing the gain) to make PHA less dependable (make it not shift) from count rate and the PHA window can then be much narrower making diff mode more efficient.

** Diff mode caveat:
While low energy X-ray PHA distribution of interfered line has no Ar esc peak - that is not the case for PHA distribution of interfering line! often Ar esc peak of interfering line has similar pulse high as interfered main PHA distribution peak - thus diff mode is not able to completely filter out the higher orders even up to 4th or 5th orders, while it would cut out main PHA distribution of interfering line, it would not cut out its Ar esc pulses. 
« Last Edit: January 03, 2023, 10:04:58 AM by sem-geologist »

sem-geologist

  • Professor
  • ****
  • Posts: 301
Re: Quantitative Spectral Interference Corrections
« Reply #10 on: January 03, 2023, 05:29:02 AM »
To add more to the discussion, the similar neglect of interference correction I witnessed also in EDS-side-of-globe.

Probeman

  • Emeritus
  • *****
  • Posts: 2831
  • Never sleeps...
    • John Donovan
Re: Quantitative Spectral Interference Corrections
« Reply #11 on: January 03, 2023, 10:52:41 AM »
But I have a question about Cameca's implementation of the interference correction: I know that Mike Jercinovic worked with Cameca quite a few years ago to make sure their interference correction was based on the quantitative concentration of the interfering element (along with a matrix correction to extrapolate from the interference standard matrix to the unknown matrix), but did Cameca ever implement an "iterative" approach for their interference correction?

For example, in the case of a "cascade" interference (as shown in the 1993 paper), where one has a Ti-V-Cr alloy where Ti Kb interferes with Va Ka and V Kb interferences with Cr Ka.  I recall the SAMx XMAS software could only handle this situation if the order of the elements in the analysis "list" was in the same order as the "cascade" interference, i.e., Ti -> V -> Cr.  So in the situation of such a "cascade" interference, does the order of the elements in the PeakSight software matter?

It is hard to answer the question as working principles are a bit enigmatic (like a black box) and idea how it is working can be intercepted from looking how output from such black box changes while changing input. I rather tend to believe it is iterative as:
1) User Manual tells it works with X-PHI (Merlet) matrix correction (Cameca has two matrix correction models: X-PHI and PAP), would it not work with PAP? I never tried that as I use X-PHI from the start of my carrier. Anyway, this rather points that it is rather iterative if correction model maters for their implementation.
2) With my mentioned ~150 corrections (for REE+HFSE) that extends (matrix) recalculation time enormously, I get impression that time needed for recalculations rises exponentially (albeit that is an impression, not precisely measured) depending from number of correction and what would take only a fraction of second without corrections, takes nearly a minute with corrections.  :o 

As for cascade interference I believe it has some chain-interference recognition mechanism. Its existence is clear from behavior. It will abort all interference corrections if any circularly closed chain is in the definition (does not depend if it is one on one (i.e. Pb_Ma vs S_Ka) or tens of chain correction jumps to get back to the chain starting element)...

Well that really sounds as if PeakSight is not performing an iterative interference calculation.  If it were, there would be no problem to correct for such "cascade" (or "chain" as you call them) interferences.

It's not a "dead breaker" of course but it's certainly a limitation.

An even more "pathological" situation is the correction of two analytical lines that interfere with each other!  If the overlap is tiny, a single application of the interference correction might be enough (Ti Ka and Ba La), but in the case of As Ka and Pb La, the iterative interference correction is essential.

Yes, PeakSight would have problem with this as that is circular chain. Albeit I can think a workaround with mentioned application of self-correcting background positions and slight off measuring the peaks... But why to measure it like that? Would not Pb Ma and As La would be a better way?

OK, then that is pretty direct evidence that the spectral interference correction is *not* iterative in PeakSight.

I only gave an example of a "self" interference with the purpose of trying to learn if the PeakSight software can handle this "self" interfering situation merely in order to determine if PeakSight performs an iterative solution.

Yes, in this particular case one might have solutions depending on the material and the analytical setup, but what if one must use PET for Ti Ka and Ba La because the LiF crystals are all used for other elements?  I'm not saying that this specific case (Pb La and As Ka) is the only example that can have such "pathological" interferences. I just gave it as one example of a "self" interference to check the PeakSight software internal workings. I should pull out my old Baumhauerite (Pb12As16S36) analyses! Here, Pb La and As Ka interfere with each other and Pb Ma and S Ka interfere with each other!     :)

Again, it's certainly not a "deal breaker", I've just always been curious how Cameca implemented their interference correction. Because at least PeakSight has some sort of an interference correction, as opposed to the JEOL EPMA software! 

As you have noted (and I began by saying with the V in Ti example), the main problem seems to be getting (some) people to recognize that these spectral interferences can indeed be corrected for with software!

  • move measurements of interfering element to different xtal to reduce its intensity

The only time this would make sense is when the other crystal has a smaller d-spacing and therefore better spectral resolution. 

For example in the case of the Ti Kb interference on V Ka, the apparent concentration of the Ti interference on vanadium in ilmenite is only around 0.4% or so using an LIF crystal, but when using a PET crystal the interference is much larger, around a few percent or so.  But as you say, using a higher resolution Bragg crystal doesn't remove the problem, it only reduces the problem!   Darn that Bragg polygonization!    >:(
I think You fail to grasp the severity of my lamentation and mixed the "interfered" with "interfering": :). The two first positions in my bizarre list has interfering (not the interfered) element measurements - that is why I have such an overwhelming urge to send some "learned"-ones back to the class to learn at least the very basics of EPMA (or the basic concept of whole family of this kind of measurements: radiation-source->sample->detection). The fallacy (do I need really to spell this here, is it not obvious?) is as supposedly the interference happens due to measuring the lines on the same spectrometer... so in Ti-V example the fallacy is if we won't measure Ti on same spectrometer (and move it to other) then V will have no interference of Ti - that is an incredible absurd. Just try to imagine of correcting someone with such a zealous misconception again the nth time... it is kind of depression-concentrate!

OK I will admit this is a very ignorant user...  has this person never taken a class in SEM/EPMA before?

I'm trying to think if I've ever had an even more ignorant user... OK here's a story from when I was at UC Berkeley (try to beat this!):  so this guy was sent to me from our SEM person because he wanted to analyze trace Na in Zn compounds and the EDS was just not getting the job done.  So I (having just published the quantitative interference paper), said, yes we can do it! So I tuned up Zn Ka and Na Ka, specified the interference of Zn La on Na Ka, and very proudly showed him the beautiful results (I think he had around 500 PPM of Na in his Zn). But he was quite upset and responded: why don't these analyses total to 100%? This analysis is 100.23, this analysis is 99.92, this analysis in 100.11. He continued: on the SEM I always get totals that are exactly 100.000%!  So I patiently responded: well, this is an actual analytical total without being normalized to 100%. There are always some small errors even just from counting statistics, and those errors results in slight differences in the results. And he said with astonishment: there are errors in your results? I cannot use results that have errors! I merely sighed and quietly asked him to leave the laboratory.

Kind of similar to attempting to utilize PHA differential mode to eliminate a higher order Brag interference. Differential mode doesn't help at all on same order interferences (e.g., our Ti kb on V Ka interference example above). At most, differential mode might *reduce* a higher order interference. But then one is stuck with all the problems of differential mode, for example non-linear response of the detector when the count rate changes due to pulse height depression. 

As you have correctly pointed out repeatedly and consequently I have now changed the way I do PHA, as I will discuss using the Ti -> V example. For example, we have discussed the importance of properly adjusting the PHA settings for the large change in count rates when performing the "constant k-ratio" method for dead time calibration (over a large range of beam currents), but we also need to consider the large change in count rates when going from a primary standard to a trace element!

https://probesoftware.com/smf/index.php?topic=1466.msg11416#msg11416

In short, better to have a linear detector response, and let all the interference "come in" and let the quantitative interference correction deal properly with them!   :)

While I use integral mode everywhere, I still use diff mode for Pb Ma, Th Ma and U Ma in conjunction with interference corrections. All of those are at lower energy than Ar K absorption, and thus there is no Ar esc peak, that simplifies the PHA problem. I want to point out that additionally to diminishing some higher order REE lines, the Diff mode in these cases significantly improves peak-background ratio by limiting also higher order bremsstrahlung background. There is still presence of problem of non-linearity as rejected pulses are not currently included in dead time correction (I mentioned in some older posts, and I got some hint that it will be included in next patch of PeakSight), but even then in these particular corner cases diff mode at low count rates provides more than takes away. Luckily diff mode is more of interest for lower energy X-rays where it is most susceptible with higher order interference and luckily these have no Ar esc pulses thus PHA distribution is simple. With no Ar esc there are some more tricks in the sleeve at disposition (i.e. reducing the bias of detector and increasing the gain) to make PHA less dependable (make it not shift) from count rate and the PHA window can then be much narrower making diff mode more efficient.

** Diff mode caveat:
While low energy X-ray PHA distribution of interfered line has no Ar esc peak - that is not the case for PHA distribution of interfering line! often Ar esc peak of interfering line has similar pulse high as interfered main PHA distribution peak - thus diff mode is not able to completely filter out the higher orders even up to 4th or 5th orders, while it would cut out main PHA distribution of interfering line, it would not cut out its Ar esc pulses.

Very good points.  Yes, I agree differential mode can be useful in specific cases.

I hadn't thought about the contribution from higher order continuum reflections, but I think they should be a very small contribution?  Do you have any measurements you can share with us?

I'm thinking I might try a measurement of say Pb Ma in my USiO4 and ThSiO4 synthetic standards with and without differential mode... would that be a good experiment to test this?
The only stupid question is the one not asked!

Probeman

  • Emeritus
  • *****
  • Posts: 2831
  • Never sleeps...
    • John Donovan
Re: Quantitative Spectral Interference Corrections
« Reply #12 on: January 04, 2023, 10:16:19 AM »
To add more to the discussion, the similar neglect of interference correction I witnessed also in EDS-side-of-globe.

I wouldn't call myself an expert on processing of EDS spectra at all, but ideally EDS deconvolution should automatically handle EDS spectral interferences assuming that ones peak profiles are appropriate and properly applied.  I believe that Nicholas Ritchie has published a number of papers looking at such deconvolution efforts.

Nevertheless an alternative approach for interference for EDS can be utilized in Probe for EPMA which treats EDS quantification by constructing k-ratios from unknown and standard spectra using net intensities exactly as done with WDS.  Because of this similar treatment, Probe for EPMA can apply interference corrections for interfering/interfered pairs not only for WDS by WDS, but also WDS by EDS, EDS by WDS and EDS by EDS as described here:

https://probesoftware.com/smf/index.php?topic=482.msg2826#msg2826
The only stupid question is the one not asked!

Nicholas Ritchie

  • Professor
  • ****
  • Posts: 141
    • NIST DTSA-II
Re: Quantitative Spectral Interference Corrections
« Reply #13 on: January 04, 2023, 10:26:56 AM »
To add more to the discussion, the similar neglect of interference correction I witnessed also in EDS-side-of-globe.

Really, there is no excuse on the EDS side.  If you are simply taking the naive ratio of the peak intensities of two interfering characteristic lines then an interference correction would be helpful.  However, a plague on any house that tries to compute EDS k-ratios by taking the ratio of single channel peak intensities or even background corrected integrals over a range of channels.  Either of these methods might be suitable for providing an intuitive sense of k-ratios in a classroom environment but neither are suitable for quantitative work.  We've had better methods since the late 1970s (see McCarthy & Schamber in NBS Special Report 604).

What all the better vendors do is fit a peak shape (either modeled or better yet measured) to the spectra so they use both shape and intensity information to extract only the characteristic intensities from the unknown spectrum.  If you do this, you fit all interfering elements simultaneously for a k-ratio solution that minimizes the chi-squared difference between the fitted and unknown spectrum.  It is a multi-parameter linear least-squares fit.  The result is the interference corrected k-ratio.  Voila!  No need to "correct for interferences."  The linear algebra does it for you.  If your vendor doesn't do it this way, get a better vendor (or DTSA-II (shameless plug :) ))
"Do what you can, with what you have, where you are"
  - Teddy Roosevelt

sem-geologist

  • Professor
  • ****
  • Posts: 301
Re: Quantitative Spectral Interference Corrections
« Reply #14 on: January 05, 2023, 09:33:33 AM »
Well that really sounds as if PeakSight is not performing an iterative interference calculation.  If it were, there would be no problem to correct for such "cascade" (or "chain" as you call them) interferences.

It's not a "dead breaker" of course but it's certainly a limitation.

....

OK, then that is pretty direct evidence that the spectral interference correction is *not* iterative in PeakSight.

I only gave an example of a "self" interference with the purpose of trying to learn if the PeakSight software can handle this "self" interfering situation merely in order to determine if PeakSight performs an iterative solution.

Maybe... I am still not convinced 100% that it really does not do that, because 1) computation time increases exponentially with every additional interference correction (this points to iteration exponential increase, else it would increase linearly and with 138 corrections should take max few sec, not whole minute); 2) There is a small difference in concentration of element which interference is not corrected by definition (in my test it is using mine defined self-correcting background position for Nd La and Sc Ka), when engaging and disengaging the interference correction (temporary renaming overlap file, to trick the PeakSight that there is no overlap definition). (The difference for Sc and Nd is there like fraction of measured percent, i.e. Sc 0.5096 wt% (with other elements corrected) where Sc 0.5085 wt% (with corrections disabled), or Nd 4.7393% vs 4.7182%. In this particular case corrections produce only ~2.5% difference in analytical totals, and there is not much HREE which would influence the Sc and Nd correction (Sm 5%, Gd 3%, Dy))

It is thus clear that PeakSight runs whole matrix correction at least once more after interference correction. Maybe it has fixed number of iterations? Or it could be that circular interference is excluded for some purpose. One of possible purpose of such limitation I guess is that PeakSight allows to define negative interference correction, that is it is possible to measure background of interfered measurement straight on peak of interfering element - I find that feature extremely handy for REE+HFSE minerals (for EPMA with LPET, LLIF, LTAP). A circular interference correction in such a case could run unsolvable number of iterations which would not converge. I guess...

I hadn't thought about the contribution from higher order continuum reflections, but I think they should be a very small contribution?  Do you have any measurements you can share with us?

It is clear then comparing WDS wavescans (with cps/nA units) gathered with different counting modes, where amplitude (peak-bkgd) is similar, but background is smaller on diff mode. At this moment I can't find particular file, I will  try to redo the showcase and will share the comparison here.
« Last Edit: January 05, 2023, 10:03:32 AM by John Donovan »