Author Topic: An alternate means of calculating detector dead time  (Read 4283 times)

Brian Joy

  • Professor
  • ****
  • Posts: 296
Re: An alternate means of calculating detector dead time
« Reply #45 on: August 20, 2022, 10:21:32 PM »
There is no shame is being wrong.  The shame is in stubbornly refusing to admit when one is wrong.

If you don't want to be laughed at, then agree that all four dead time correction equations produce the same results at low count rates as demonstrated in this graph:

Please reread my previous post and please look at my plots.  I am not going to restate my argument.

I am not asking you to restate your argument.

I am asking to you answer the question:  do all four dead time correction equations produce the same results at low count rates as demonstrated in this graph?


Within a fraction of a photon count!

User specified dead time constant in usec is: 1.5
Column headings indicates number of Taylor expansion series terms (nt=log)
obsv cps    1t pred   1t obs/pre    2t pred   2t obs/pre    6t pred   6t obs/pre    nt pred   nt obs/pre   
       0          0          0          0          0          0          0          0          0   
    1000   1001.502     0.9985   1001.503   0.9984989   1001.503   0.9984989   1001.503   0.9984989   
    2000   2006.018      0.997   2006.027   0.9969955   2006.027   0.9969955   2006.027   0.9969955   
    3000   3013.561     0.9955   3013.592   0.9954898   3013.592   0.9954898   3013.592   0.9954898   
    4000   4024.145      0.994   4024.218   0.993982    4024.218   0.993982   4024.218    0.993982   
    5000   5037.783     0.9925   5037.926   0.9924719   5037.927   0.9924718   5037.927   0.9924718   
    6000    6054.49    0.99100   6054.738   0.9909595   6054.739   0.9909593   6054.739   0.9909593   
    7000    7074.28     0.9895   7074.674   0.9894449   7074.677   0.9894445   7074.677   0.9894445   
    8000   8097.166      0.988   8097.756   0.987928   8097.761   0.9879274    8097.761   0.9879274   


In fact, they do produce similar corrections at low count rates, though they only give exactly the same result when the count rate is zero.  But this is not necessarily the source of the problems with your modeling.  Let me respond with another plot with more appropriate scaling; it pertains to my correction constant determined by linear regression for channel 4/TAPJ/Si for the region in which the linear model corrects the data well.  If my point is not clear, then please reread my lengthy post above, especially the long paragraph:


« Last Edit: August 21, 2022, 12:20:27 AM by Brian Joy »
Brian Joy
Queen's University
Kingston, Ontario
JEOL JXA-8230

Probeman

  • Emeritus
  • *****
  • Posts: 2831
  • Never sleeps...
    • John Donovan
Re: An alternate means of calculating detector dead time
« Reply #46 on: August 21, 2022, 09:25:21 AM »
I am not asking you to restate your argument.

I am asking to you answer the question:  do all four dead time correction equations produce the same results at low count rates as demonstrated in this graph?


In fact, they do produce similar corrections at low count rates, though they only give exactly the same result when the count rate is zero. 

Thank-you! 

In fact at 1.5 usec,  they (the traditional vs. logarithmic expressions) produce results that are the same within 1 part in 10,000,000 at 1000 cps, 1 part in 100,000 at 10K cps and 1 part in 10,000 at 20K cps.  So much for your claims that the traditional expression "substantially outperforms the logarithmic expression at low count rates"!

And do you know why they start diverging at a few tens of thousands of cps? Because the traditional expression is not handling multiple photon coincidence, which Monte Carlo modeling confirms are due to these relatively infrequent multiple photon events at these relatively low count rates.  And as you have previously admitted already, at higher count rates, the traditional expression fails even worse.

But this is not necessarily the source of the problems with your modeling.  Let me respond with another plot with more appropriate scaling; it pertains to my correction constant determined by linear regression for channel 4/TAPJ/Si for the region in which the linear model corrects the data well.  If my point is not clear, then please reread my lengthy post above, especially the long paragraph:

Since you don't show us the actual data (why is that?), I can't tell if you are being disingenuous or just honestly not understanding what you are doing.  You apparently want us to accept your claim that the data are "corrected well".  So let's just accept that for now because I'm going to assume you are arguing in good faith.

The real problem is that you show us that both expressions at 1.07 usec yield very similar slopes. Of course they would wouldn't they, as you finally admitted above.  But then you show us another slope (blue line) using the logarithmic expression at 1.19 usec (though strangely enough you don't also show us the traditional expression at 1.19 usec, why is that?).

In fact it's even stranger that you decided to show us the logarithmic expression using a *higher" dead time constant, because if you thought for even a minute about this you would realize that when correcting for both single and multiple photon coincidence (using the logarithmic expression), the dead time constant must be (very) slightly decreased, not increased (compared to the traditional expression)!    >:(   

This is because the traditional expression does not account for multiple photon coincidence and therefore when regressing intensity data to a straight line, it starts to be biased towards higher dead time values than it should be, when including count rates above 20 to 30K cps or so.  This small fact is what you have been overlooking this whole time.

Please plot the traditional expression at 1.07 usec, and the logarithmic expression at 1.06 usec, you know, 0.01 usec different, and let us know what you see!  Awww nevermind, here it is for you:


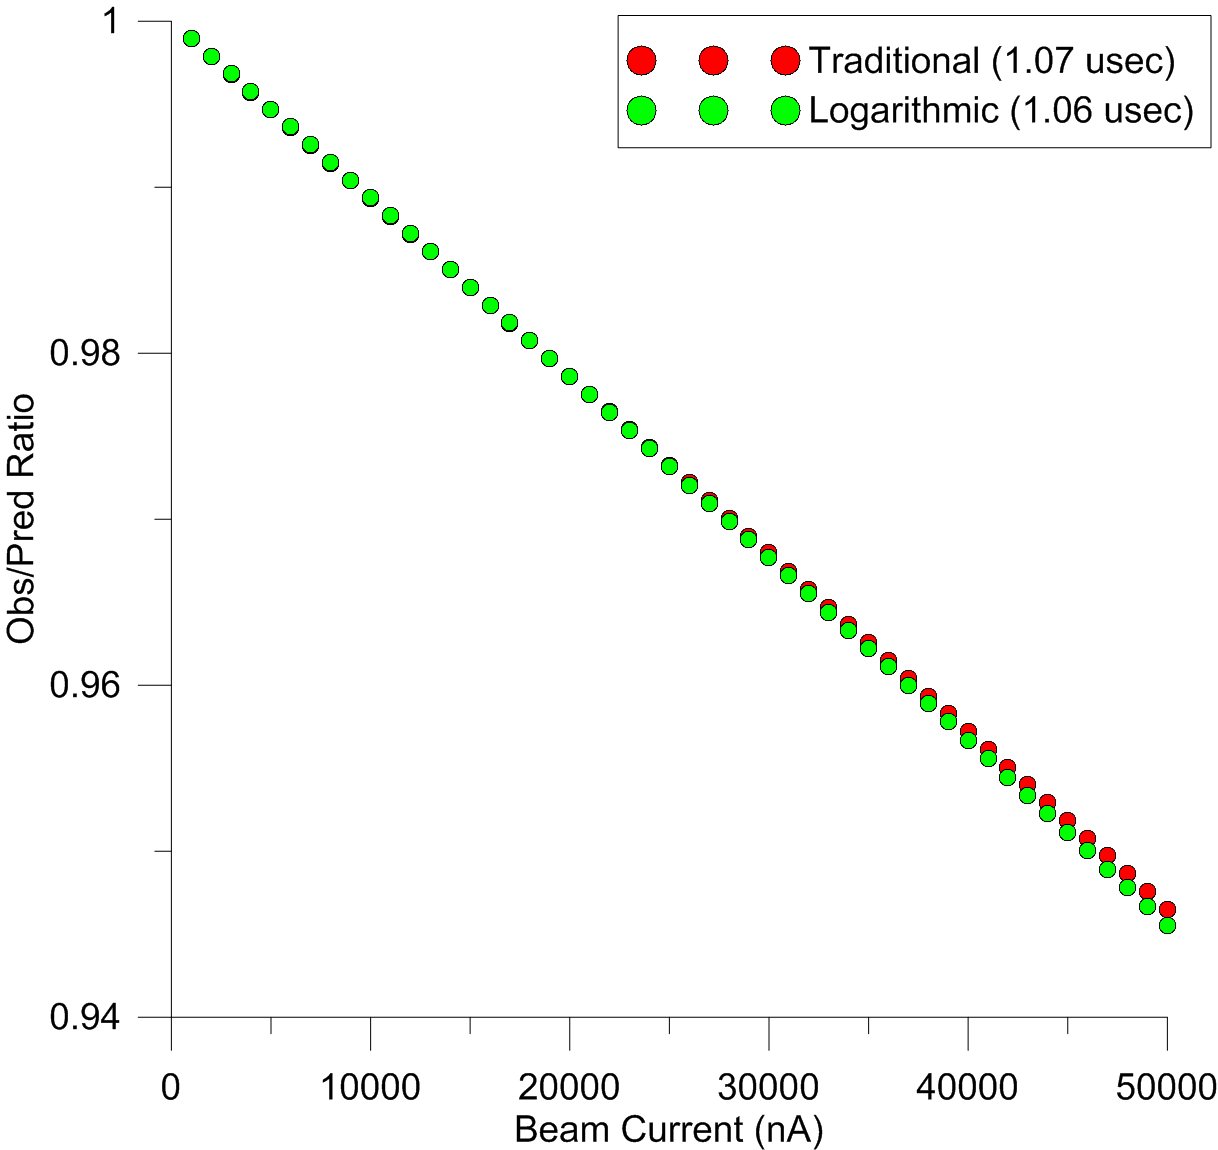
Note nearly identical response until we get to 30K cps or so.  So it's strange that you choose to not only change the dead time constant for the logarithmic expression by a huge amount, but also in exactly the *wrong direction*...  so is this an honest mistake or what?   Sorry, but I really have to ask.

I still think actual EPMA data shows these differences quite well (and especially well using the constant k-ratio method, as I will be writing about next in constant k-ratio topic). So I will leave you with this plot which clearly shows that both expressions yield statistically identical results at 10 nA (15K cps on TiO2), but the traditional method visibly starts lose accuracy at around 30 nA (45K cps) and the wheels are already coming off around 40 na (60K cps):


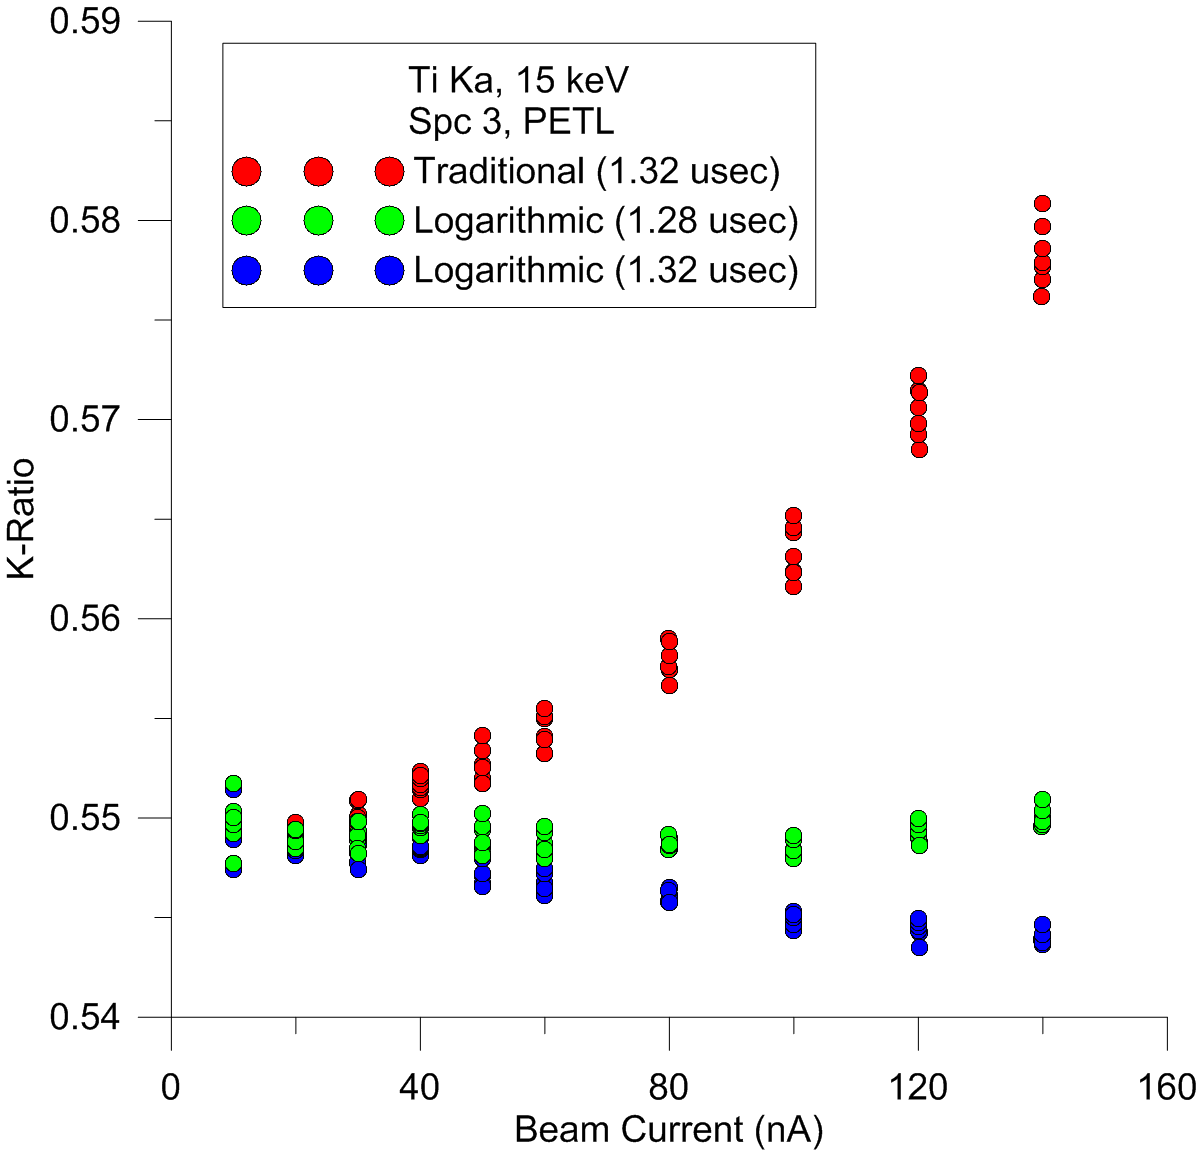
Again, please note that the dead time constant must be *reduced* not increased, when correcting for multiple coincidence photon events exactly as one would expect. Maybe you need to answer this question next:

Do you agree that one (ideally) should obtain the same k-ratio over a range of beam currents, if the dead time correction is being properly applied?
« Last Edit: August 21, 2022, 10:07:31 AM by Probeman »
The only stupid question is the one not asked!

Brian Joy

  • Professor
  • ****
  • Posts: 296
Re: An alternate means of calculating detector dead time
« Reply #47 on: August 21, 2022, 01:10:58 PM »
I did not show the data on my last plot because they are constrained to lie on a given curve.  Please think about this.

Nowhere have you proven that the correction constant must be lowered to make your model fit the data better.  As I’ve already pointed out repeatedly, the linear fit at low count rate fixes the value of that constant.

Yes, of course, the k-ratio should be constant for given effective takeoff angle.

Below once again is a plot of my data for Si measurement set 2.  I’ll let you imagine how lowering the value of the correction constant will affect the fit, as I’ve already plotted your function for two different values.  The open black circles represent the Willis model.

At this point, we are just going around in circles.  If you post a response that includes disrespectful language or that can be addressed easily by what I have already posted (as above), then I will either not respond to it or will just ask you to reread what I have already written.


Brian Joy
Queen's University
Kingston, Ontario
JEOL JXA-8230

Probeman

  • Emeritus
  • *****
  • Posts: 2831
  • Never sleeps...
    • John Donovan
Re: An alternate means of calculating detector dead time
« Reply #48 on: August 21, 2022, 01:38:26 PM »
Nowhere have you proven that the correction constant must be lowered to make your model fit the data better.  As I’ve already pointed out repeatedly, the linear fit at low count rate fixes the value of that constant. 

What?  No, you've assumed that. You are in fact wrong as I demonstrated in the data!  Here is is again:


The data using the traditional expression is wildly wrong (admit it). The data using the logarithmic expression is very slightly over correcting (right?),  due to its ability to handle multiple photon coincidence. So we slightly reduce the value to 1.28 usec and we now have constant k-ratios over a wide range of beam currents, that works perfectly at low, moderate and high beam currents. 

Voila!

You are stubbornly unable to realize that even at low counts rates there are still non-zero probabilities of multiple photon coincidence.  So the linear model is (slightly) biased towards higher dead time constants because of these (non linear) events.  However, the logarithmic expression properly deals with these probabilities so it determines a slightly lower dead time.  That's good news that our detectors are slightly faster than we thought, hey?

Yes, of course, the k-ratio should be constant for given effective takeoff angle.

Well thank goodness for that. 

Now please explain why we should not adjust the dead time constant (slightly) to compensate for the fact that the linear expression does not account for multiple photon coincidence.  We do this because the traditional model is physically unrealistic in that it does not account for multiple photon coincidence, so we need to make an adjustment in order to obtain because, as you just stated, the "k-ratio should be constant for given effective takeoff angle".

Below once again is a plot of my data for Si measurement set 2.  I’ll let you imagine how lowering the value of the correction constant will affect the fit, as I’ve already plotted your function for two different values.  The open black circles represent the Willis model.

OK, I see the problem in your plot. Your plotting the logarithmic expression using the same dead time as the traditional expression. Of course it will slightly over correct the data at moderate count rates (before it gets much better at high count rates).  Just as I showed in the k-ratio plot above.

You've simply assumed that the dead time constant obtained from a linear regression using the traditional expression has to be the correct value.  So you're assuming the point you're trying to prove.   :o

You really don't see that?   Really?
The only stupid question is the one not asked!

Brian Joy

  • Professor
  • ****
  • Posts: 296
Re: An alternate means of calculating detector dead time
« Reply #49 on: August 21, 2022, 02:20:15 PM »
OK, I see the problem in your plot. Your plotting the logarithmic expression using the same dead time as the traditional expression. Of course it will slightly over correct the data at moderate count rates (before it gets much better at high count rates).  Just as I showed in the k-ratio plot above.

You've simply assumed that the dead time constant obtained from a linear regression using the traditional expression has to be the correct value.  So you're assuming the point you're trying to prove.   :o

You really don't see that?   Really?

As I already stated, I've plotted your correction using two different values for the correction constant.  Please look more closely at my plot.
Brian Joy
Queen's University
Kingston, Ontario
JEOL JXA-8230

Probeman

  • Emeritus
  • *****
  • Posts: 2831
  • Never sleeps...
    • John Donovan
Re: An alternate means of calculating detector dead time
« Reply #50 on: August 21, 2022, 03:23:20 PM »
As I already stated, I've plotted your correction using two different values for the correction constant.  Please look more closely at my plot.

Yes, at 1.07 usec and 1.19 usec.  I can think of a few more numbers in between 1.07 and 1.19 usec. Can anyone else?    ;D

I also note in your plot that the new expressions (except for the deliberately over corrected values at 1.19 msec) provide equal accuracy at low count rates and *better* accuracy at higher count rates.  That is progress- that you deliberately ignore.

What dead time constant are you using for the traditional expression?  You don't show in your plot.  Why don't you plot the data up again, but this time with the logarithmic expression at 1.08 or 1.1 or 1.12 usec, for example?  Or better yet, plot the data with the traditional expression at whatever dead time you determined using that expression, and then plot the logarithmic expression at the same dead time constant and then slowly decrease the dead time by 0.02 usec at a time and plot all those up?  I bet you'll learn something.   :)

Let me ask you this: is there any possibility of mulitple photon coincidence events at these 10K or 20K count rates? 

If you answer no, then you are making unphysical assumptions about the random nature of photon emission.

If you answer yes, then only by using an expression that includes these probablities can the correct dead time constant be determined. Simply because  the traditional linear expression is biased against multiple photon events and that skews your dead time determinations too high.
« Last Edit: August 21, 2022, 03:33:16 PM by Probeman »
The only stupid question is the one not asked!

Brian Joy

  • Professor
  • ****
  • Posts: 296
Re: An alternate means of calculating detector dead time
« Reply #51 on: August 21, 2022, 03:44:24 PM »
As I already stated, I've plotted your correction using two different values for the correction constant.  Please look more closely at my plot.

Yes, at 1.07 usec and 1.19 usec.  I can think of a few more numbers in between 1.07 and 1.19 usec. Can anyone else?    ;D

I also note in your plot that the new expressions (except for the deliberately over corrected values at 1.19 msec) provide equal accuracy at low count rates and *better* accuracy at higher count rates.  That is progress- that you deliberately ignore.

What dead time constant are you using for the traditional expression?  You don't show in your plot.  Why don't you plot the data up again, but this time with the logarithmic expression at 1.08 or 1.1 or 1.12 usec, for example?  Or better yet, plot the data with the traditional expression at whatever dead time you determined using that expression, and then plot the logarithmic expression at the same dead time constant and then slowly decrease the dead time by 0.02 usec at a time and plot all those up?  I bet you'll learn something.   :)

Let me ask you this: is there any possibility of mulitple photon coincidence events at these 10K or 20K count rates? 

If you answer no, then you are making unphysical assumptions about the random nature of photon emission.

If you answer yes, then only by using an expression that includes these probablities can the correct dead time constant be determined. Simply because  the traditional linear expression is biased against multiple photon events and that skews your dead time determinations too high.

I've shown the results of your model for different correction constants in my "delta" plots for Si.  Please reread my posts and look at my plots.  I'm done conversing with you on this subject, as you aren't mentioning anything that I haven't already addressed.  Further, your tone is demeaning and patronizing.  Feel free to have the last word if you'd like, though.

On a tangential note, I'd like to point out that Ti metal is notorious for rapid development of an oxide film.  It is not a good choice for making k-ratio measurements/calculations.
« Last Edit: August 21, 2022, 06:50:15 PM by Brian Joy »
Brian Joy
Queen's University
Kingston, Ontario
JEOL JXA-8230

Probeman

  • Emeritus
  • *****
  • Posts: 2831
  • Never sleeps...
    • John Donovan
Re: An alternate means of calculating detector dead time
« Reply #52 on: August 21, 2022, 06:55:36 PM »
Let me ask you this: is there any possibility of mulitple photon coincidence events at these 10K or 20K count rates? 

If you answer no, then you are making unphysical assumptions about the random nature of photon emission.

If you answer yes, then only by using an expression that includes these probablities can the correct dead time constant be determined. Simply because  the traditional linear expression is biased against multiple photon events and that skews your dead time determinations too high.

I've shown the results of your model for different correction constants in my "delta" plots for Si.  Please reread my posts and look at my plots.  I'm done conversing with you on this subject, as you aren't mentioning anything that I haven't already addressed.  Further, your tone is demeaning and patronizing.  Feel free to have the last word if you'd like, though.

I've done that and explained what you're doing wrong, but I can see that you're determined to die on that hill. So be it.

On a tangential note, I'd like to point out that Ti metal is notorious for rapid development of an oxide film.  It is not a good choice for making k-ratio measurements.

This only goes to show how you just don't get it at all.    ::)

The cool thing about the "constant k-ratio" method is that it doesn't matter what the k-ratio is, only that it is constant as a function of beam current!   

We could just as well use two unknown compositions, so long as they contain significantly different concentrations of the element, and are relatively beam stable and homogeneous.
« Last Edit: August 21, 2022, 07:03:57 PM by Probeman »
The only stupid question is the one not asked!