I just need some clarification, I have run primary standards as part of a large package for both calibration and interference corrections. I have also run some of these standards as "unknowns" to check the results as I am running (i.e. not as type "standard"). Is it possible to now use these standards which were run as "unknowns" to conduct a drift correction? Or do these need to be set as "standards" before acquisition to be able to use the drift correction feature?
Hi Edeltraud,
Unfortunately, it is not possible to convert unknowns into standards at this time. Though standards *are* treated as unknowns in the Analyze! window for the purposes of evaluating accuracy as you probably know. The main difference is that because the program knows these samples are actually standards, it will automatically include elements present in the standard but missing from the acquisition, into the matrix correction automatically. Also, the program will print out the "PUBL:" or published composition of the standards so one can compare your secondary standard measurements with the published values for accuracy.
This package is quite large and has 28 elements in it + standards are mounted on two different shuttles so not possible to run all standard checks all the time. The data looks fairly consistent in terms of the values attained for the standards as unknowns, but it was run over a 1-2 week period so I wanted to test if drift correction was required. Is this now possible?
Remember this: the "List Report" button in the Analyze! window is "your friend"!

Clicking this button for a selected sample will force the software to list all standard intensities that correspond to the assigned standards of the selected sample. For example here is the List Report output from a large run:
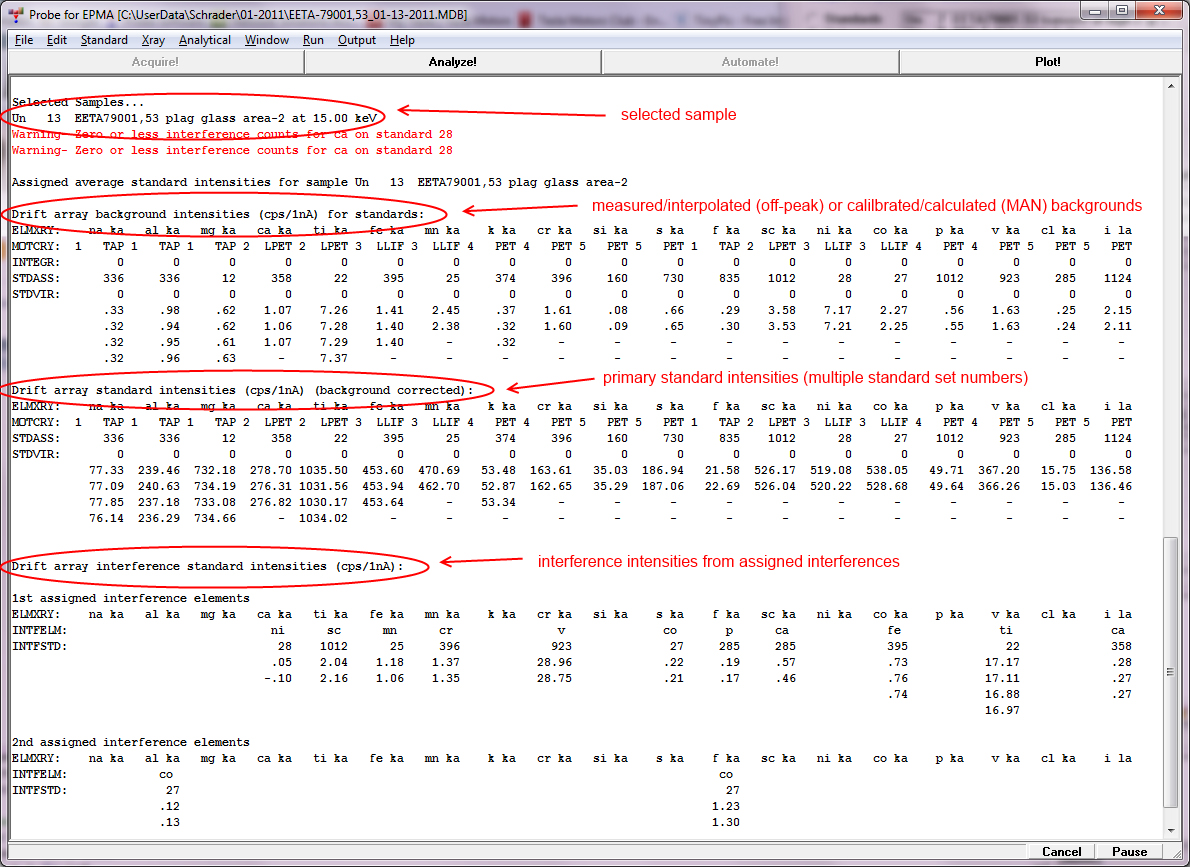
Each intensity listed in the primary standard intensity section is the average of multiple standard points for each standard set number (1, 2, 3, etc...). In this particular run the variations in intensities seem to be mostly statistical.
Let's examine it in more detail, for example the warning about the zero or negative Ni counts for the specified Ca interference correction is so close to zero that it may not need to be specified at all. It essentially is having no effect on the analysis.
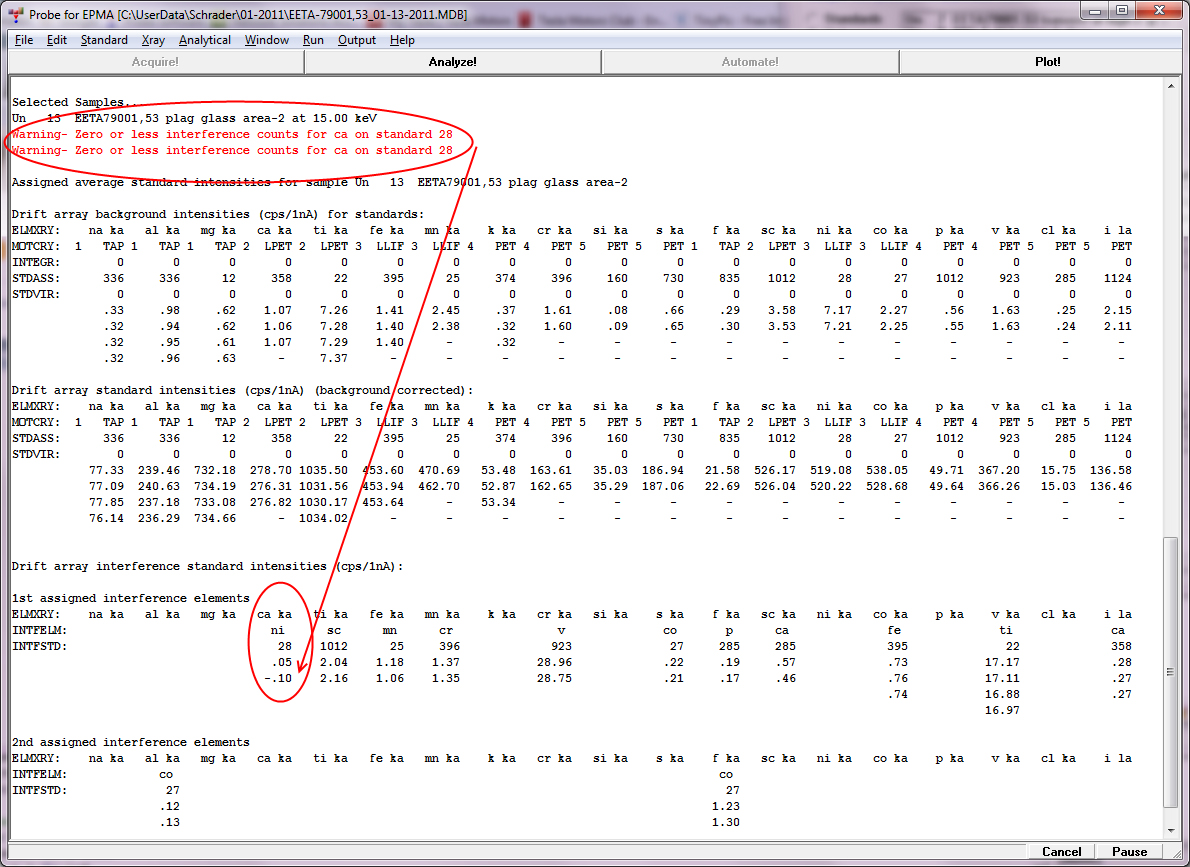
Meanwhile the primary standard intensities look pretty consistent between standard sets. Note that if you delete a standard set completely, the List Report button will *not* list the standard intensity in the List Report output. The the first listed standard intensity is usually Set 1, but if there was a previous standard set acquired before that and subsequently deleted, the next (Set 2) undeleted standard set will be listed first.
A couple of other datasets have been run for a few days, then a few weeks off and more data appended to the same database. I assume that when I recalibrated for the datasets that were appended to an older set - that drift correction in this case will occur to all unknowns that were run in between the standard sets? Is this correct?
The standard drift correction (unless turned off in the Analytical | Analysis Options menu dialog) is automatically applied. Basically it searches for the last standardization prior to the selected sample (being analyzed) and also the first standardization after the selected sample (being analyzed). If a prior or subsequent standardization is *not* available, the program will utilize the one standardization available.
Here's a couple more useful tips:
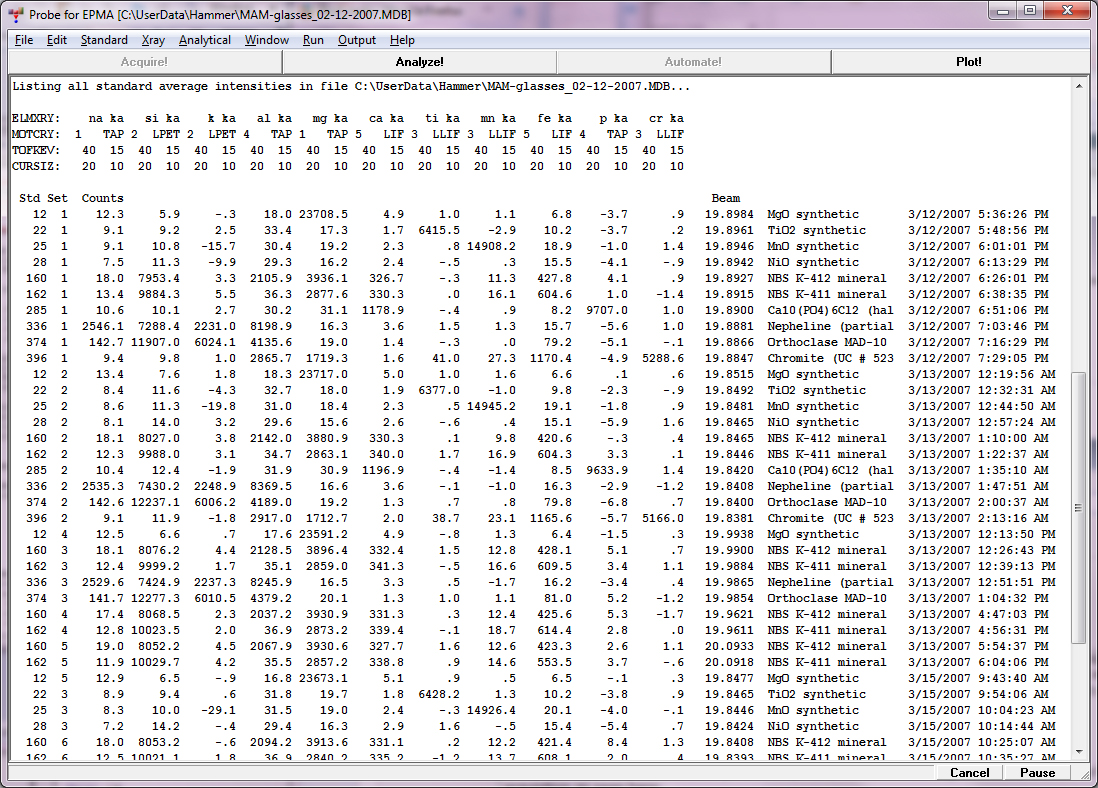
1. The Run | List Standard Counts (Intensities) menu will list the average standard intensities for *every* standard acquisition as seen here:
2. But my favorite feature for evaluating a large number of standard intensities is also available from the Run menu. This is the output from the Run | List Anomalous Intensity Data From Standards Or Unknowns menu. I clicked the No button to see standard intensities listed. Simply click the Yes button for testing unknown sample intensities:
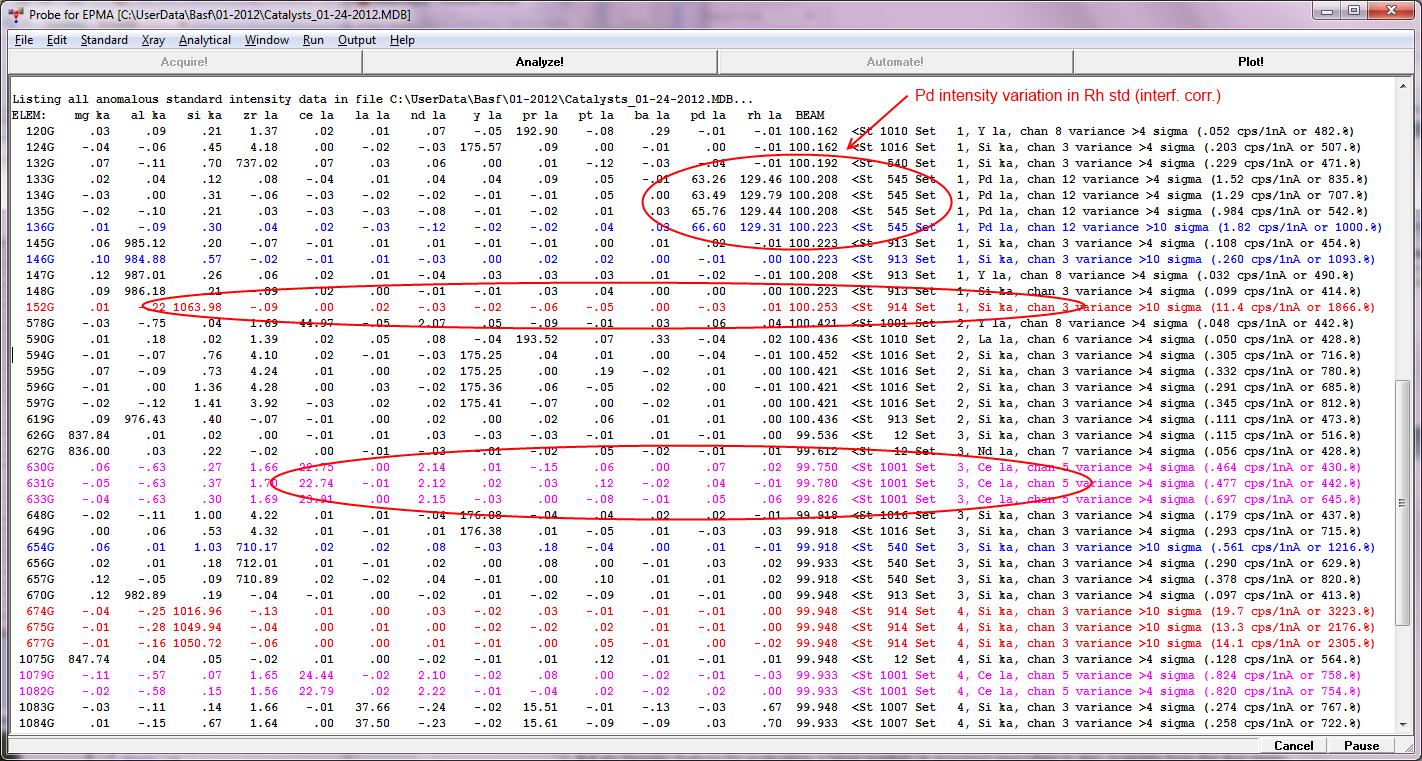
Simply note that for standard intensities.
Black color indicates an element channel that is *not* utilized for any calculations and has point intensity deviations that are greater than 4 times the predicted variance of that channel.
Blue color indicates an element channel that is *not* utilized for any calculations and has point intensity deviations that are greater than 10 times the predicted variance of that channel.
Magenta color indicates an element channel that is utilized for standard calculations and has point intensities that are greater than 4 times the predicted variance of that channel.
Red color indicates an element channel that is utilized for standard calculations and has point intensities that are greater than 10 times the predicted variance of that channel.For unknown samples the key is simpler:
Black color indicates an element channel that has point intensity deviations that are greater than 4 times the predicted variance of that channel.
Blue color indicates an element channel that has point intensity deviations that are greater than 10 times the predicted variance of that channel.


