Author Topic: Duane-Hunt limit  (Read 7160 times)

Nicholas Ritchie

  • Professor
  • ****
  • Posts: 141
    • NIST DTSA-II
Re: Duane-Hunt limit
« Reply #15 on: January 25, 2024, 07:52:05 AM »
The other challenge I didn't mention when fitting the Duane-Hunt to an EDS spectrum (or, presumably, a wavescan) is that, when the issue is charging, the charging is dynamic and the Duane-Hunt isn't a single number.  When you model the continuum to fit the D-H, you assume a nominal continuum shape.  However, dynamic charging can lead to a very strange looking continuum particularly near the limit.  I wouldn't trust the DH where there is charging.  It is probably better than assuming the nominal beam energy but...  :o
"Do what you can, with what you have, where you are"
  - Teddy Roosevelt

Probeman

  • Emeritus
  • *****
  • Posts: 2839
  • Never sleeps...
    • John Donovan
Re: Duane-Hunt limit
« Reply #16 on: January 27, 2024, 01:22:27 PM »
Adding to my previous checks on the DH limit at 13 keV on WDS (see above), I also acquired EDS spectra at the same time as the WDS scans (~4.4 hours each).  Here is the energy calibration check on Ge metal:


Pretty good looking. Next a zoom in on the DH limit on Ge:


Now on Ta:


And finally on Pt:


I think it's safe to conclude that our high voltage source is calibrated a bit too high...  the irony of course is that when I purchased this instrument back in 2005 (so I guess it could have drifted since then), I had included in my purchase specifications that Cameca provide calibration data showing that the high voltage source was calibrated (prior to shipping) to within our specifications:

Quote
b) absolute accuracy of accelerating voltage at 3, 5, 10, 15 and 20 KeV must be less than 0.5 % (+/- 0.25%) from the nominal accelerating voltage or within 7.5 volts at 3 KeV, 12.5 volts at 5 KeV, 25 volts at 10 KeV, 37.5 volts at 15 KeV and within 50 volts of 20 KeV as determined using the Duane-Hunt limit test on EDS (when calibrated on known x-ray line energies, Eg, Cu Ka, Cu La)

https://epmalab.uoregon.edu/reports/UofO-SPEC_EPMA-2004.pdf

Sounds like a good plan, right?  Well a week after installing the high voltage source and hooking it up to the chiller, the Cameca engineer accidentally left the chiller on with the thermostat set so low that condensation starting occurring in the HV tank, then there a loud bang and that was the end of that HV transformer!

So they shipped another HV transformer, and did they test it before they shipped the new transformer?  I don't remember, but it's certainly not within specifications any longer!

Does anyone have a procedure for adjusting the HV transformer in a Cameca?
« Last Edit: January 27, 2024, 05:41:02 PM by Probeman »
The only stupid question is the one not asked!

sem-geologist

  • Professor
  • ****
  • Posts: 302
Re: Duane-Hunt limit
« Reply #17 on: January 28, 2024, 05:48:16 AM »
I should apologize as I had not found enough time to make a proper explanation. Two probes are down at our lab, and troubleshooting and getting at least one on-line took my time and attention.

Does anyone have a procedure for adjusting the HV transformer in a Cameca?

I am aware there is potentiometer for exactly that purpose there kind-of "accessible" from outside of HV tank case, but I firmly believe !!! This should not be attempted at customer-site as these voltages (together with current storage in the tank) are absolutely lethal!!!
While it is at low Voltage side of tank it is better not take the risk. Also see my rambling below, as I am pretty sure You don't need to do any of that. Also HV tank calibration should be attempted only and only if problem is not somewhere else. I.e. fatique of cable isolation, breakage of terminating clam diodes (can pull up or down reference voltage). System (software) shows what HV voltage were set by reading reference voltage at output of DAC output, before it is terminated, transported by cable, received by HV regulation board, converted into voltage/current for supplying HV transformer - there is many steps where it could go wrong. Especially I would suspect that at first if requesting HV values at software return something else than what is set (In your case it was previously reported 14.88kV instead of 15kV).

I think it's safe to conclude that our high voltage source is calibrated a bit too high...  the irony of course is that when I purchased this instrument back in 2005 (so I guess it could have drifted since then), I had included in my purchase specifications that Cameca provide calibration data showing that the high voltage source was calibrated (prior to shipping) to within our specifications:

I would risk to say that it is very probably contrary to what you think, if the DH limit measurements were done exactly as You demonstrate here above, - it is most probable that initial HV tank was unintentionally miss-regulated and thus unintentionally was set out of specs, and your current HV tank is actually within specs. The key point (the missing piece in yours (and other's) fitting method) is this: the count distribution of X-ray energies, as we see acquired by X-ray detectors, are the real (energetically very narrow) X-ray distributions convoluted enormously by detection processes. Thus, DH limit estimation needs to take into account that background is affected by such convolution exactly in the same manner as the characteristic X-ray peaks (which are initially lines).

Had You tried to replicate my DTSA-II MC experiment? I highly recommend  that:
1. simulate some low Z EDS: i.e. MgO; medium Z: ZrO, ZnAs2, heavy Z: Bi, Th....
2. use .duaneHunt() function in scripting tab for these simulated spectras; (optionally (or maybe mandatory): look and witness on the EDS plots how these simulated spectra go over set acceleration voltages ... and No, DTSA-II does not simulate peak pile-ups - that effect is there is purelly due to convolution by simulated detector on properly simulated initial X-ray spectrum)
3. notice that  DH will be not the same than defined landing energy defined in simulation parameters:
* lowest Z materials will get closest to the defined HV, heaviest materials will have very much overestimated DH than HV.

Why is that like that? I believe DTSA-II does no deconvolution before fitting the line for getting the interference with 0 intensity. The deconvolution is more important the steeper the slope is, thus that is why D-H kinda works for very low Z materials (in DTSA-II), but it is severely overestimated with very high Z materials. In real-life EDS there is also these pileup peaks of continuum.  The caveat is that pileup tail does not start where real "non-pile-up'ed" spectra finishes (D-H) and spreads to higher energies from there, but it spreads practically from low energy (2x lowest channel) of spectra to 2x energies of DH. (also there can be 3x and 4x, but those are extremely rare events). Overlapping pileuped continuum counts will shift whole slope (which is fitted for D-H) to higher energies. EDS as means for precise DH estimation for acceleration voltage validation or calibration is absolutely unreliable.

As for WDS, I suggest to repeat the experiment at lower energy (we saw in Henderson example that 10kV works ok) - and even there the same - "3 sigma" (half width at base of the peak) of peak will need to be subtracted from interpolated 0 intensity intersection point (The peak width can be determined at first at higher acceleration voltage making a wavescan of some element with its characteristic X-ray line near that aimed limit; i.e. near 10keV is Ge Ka; in my case half width at base of Voigt-shaped peak of Ge Ka on one of LLIF (actually aglomeration of Ka1, Ka2, and Ka3) is about 150keV, thus 150keV needs to be subtracted then from interpolated at 0 intensity point for get correct D-H estimation).

P.S. I would demonstrate this WDS experiment myself, but I still am at the path of switching back our SXFiveFE online. And BTW, I got aware about this D-H problem due to problems with HV tank on our SX100 and looking for alternatives (manufacturers of HV supplies gives 2% to 1% accuracy for HV). Testing HV on SXFiveFE is also different beast, as it is no more Cameca designed and in-house manufactured HV tank, but a third party, YPS FEG power supply - I am aware that there is some minor difference between set and get voltage readings there already. I am waiting for some time gap to do some experiments.
« Last Edit: January 28, 2024, 07:52:24 AM by sem-geologist »

Probeman

  • Emeritus
  • *****
  • Posts: 2839
  • Never sleeps...
    • John Donovan
Re: Duane-Hunt limit
« Reply #18 on: January 28, 2024, 03:03:12 PM »
I should apologize as I had not found enough time to make a proper explanation. Two probes are down at our lab, and troubleshooting and getting at least one on-line took my time and attention.

No need to apologize as it gave me some time to do these measurements!     ;D

Does anyone have a procedure for adjusting the HV transformer in a Cameca?

I am aware there is potentiometer for exactly that purpose there kind-of "accessible" from outside of HV tank case, but I firmly believe !!! This should not be attempted at customer-site as these voltages (together with current storage in the tank) are absolutely lethal!!!

Don't worry, I will leave this to our in-house instrument engineer, he is used to dealing with high voltages!

I think it's safe to conclude that our high voltage source is calibrated a bit too high...  the irony of course is that when I purchased this instrument back in 2005 (so I guess it could have drifted since then), I had included in my purchase specifications that Cameca provide calibration data showing that the high voltage source was calibrated (prior to shipping) to within our specifications:

I would risk to say that it is very probably contrary to what you think, if the DH limit measurements were done exactly as You demonstrate here above, - it is most probable that initial HV tank was unintentionally miss-regulated and thus unintentionally was set out of specs, and your current HV tank is actually within specs. The key point (the missing piece in yours (and other's) fitting method) is this: the count distribution of X-ray energies, as we see acquired by X-ray detectors, are the real (energetically very narrow) X-ray distributions convoluted enormously by detection processes. Thus, DH limit estimation needs to take into account that background is affected by such convolution exactly in the same manner as the characteristic X-ray peaks (which are initially lines).
...
As for WDS, I suggest to repeat the experiment at lower energy (we saw in Henderson example that 10kV works ok) - and even there the same - "3 sigma" (half width at base of the peak) of peak will need to be subtracted from interpolated 0 intensity intersection point (The peak width can be determined at first at higher acceleration voltage making a wavescan of some element with its characteristic X-ray line near that aimed limit; i.e. near 10keV is Ge Ka; in my case half width at base of Voigt-shaped peak of Ge Ka on one of LLIF (actually aglomeration of Ka1, Ka2, and Ka3) is about 150keV, thus 150keV needs to be subtracted then from interpolated at 0 intensity point for get correct D-H estimation).

You know, I think you may be correct on this. 

So I took my Ge metal scan and roughly obtained a base width of ~160 eV or 80 eV for half that. Not sure why my LLIF crystal seems to have better resolution than yours.  My normal size LiF looks exactly the same interestingly enough:


Now if I apply that 80 eV offset I do indeed get closer to 13 keV, but maybe still a little above?


So now I need to re-run at 10 keV... and see what that reveals for WDS (and EDS).   

But I'm still thinking about why DH limit would be different for different atomic numbers.  There does indeed seem to be a small effect in the above plot. Have you also measured this?

« Last Edit: January 28, 2024, 03:32:51 PM by Probeman »
The only stupid question is the one not asked!

sem-geologist

  • Professor
  • ****
  • Posts: 302
Re: Duane-Hunt limit
« Reply #19 on: January 28, 2024, 04:13:52 PM »
This 80eV would be closer to correct value to subtract if HV was 10keV. At 13keV it should be wider as intensities and peak width increases, especially close to the smallest sin theta (highest energy on spectrometer). Ge Ka half base width is applicable for 10keV DH experiments.

But I'm still thinking about why DH limit would be different for different atomic numbers.  There does indeed seem to be a small effect in the above plot. Have you also measured this?

It is not real physical DH limit which differ, it is perceived limit on spectra. Why? Because convolution by same function makes different impact on different slopes. We know convolution (or rather use it maybe even not knowing it) from image processing, i.e. smoothing algorithms is nothing else as convolution. Convolution will smooth high gradients and keep already smooth graditients intact in the image (i.e. Gaussian blurring works like that). And in convolving 1D array (spectra) is exactly the same as in 2D convolution - steep slope will be made more shallow, but shallow slope will be left as is. And so perceived DH for heavier elements has its slope pointing toward real DH after convolution made more shallow which leads to shifting of its interference with 0 point toward the higher energies. For low Z material the slope will be already so shallow that smoothing by convolution won't change the slope and thus it will still point to the real DH position. This applies for EDS. WDS is more simple as slope will be steep enough for "peak-base half width" be applicable despite different Z of material. There is also important question and point of individual perception at measuring base of the peak, maybe our LLIF have similar FWHM, but I get wider base as I am more pessimistic :P ?

What is the uncertainty of my eyes? I guess about 50% plus/minus content in my drink... But getting more serious - how do we measure the base of the peak - that is huge ground for uncertainty on DH estimation even with WDS.

« Last Edit: January 28, 2024, 04:17:00 PM by sem-geologist »

Probeman

  • Emeritus
  • *****
  • Posts: 2839
  • Never sleeps...
    • John Donovan
Re: Duane-Hunt limit
« Reply #20 on: January 28, 2024, 04:38:19 PM »
This 80eV would be closer to correct value to subtract if HV was 10keV. At 13keV it should be wider as intensities and peak width increases, especially close to the smallest sin theta (highest energy on spectrometer). Ge Ka half base width is applicable for 10keV DH experiments.

But I'm still thinking about why DH limit would be different for different atomic numbers.  There does indeed seem to be a small effect in the above plot. Have you also measured this?

It is not real physical DH limit which differ, it is perceived limit on spectra. Why? Because convolution by same function makes different impact on different slopes. We know convolution (or rather use it maybe even not knowing it) from image processing, i.e. smoothing algorithms is nothing else as convolution. Convolution will smooth high gradients and keep already smooth gradients intact in the image (i.e. Gaussian blurring works like that). And in convolving 1D array (spectra) is exactly the same as in 2D convolution - steep slope will be made more shallow, but shallow slope will be left as is. And so perceived DH for heavier elements has its slope pointing toward real DH after convolution made more shallow which leads to shifting of its interference with 0 point toward the higher energies. For low Z material the slope will be already so shallow that smoothing by convolution won't change the slope and thus it will still point to the real DH position. This applies for EDS. WDS is more simple as slope will be steep enough for "peak-base half width" be applicable despite different Z of material. There is also important question and point of individual perception at measuring base of the peak, maybe our LLIF have similar FWHM, but I get wider base as I am more pessimistic :P ?

What is the uncertainty of my eyes? I guess about 50% plus/minus content in my drink... But getting more serious - how do we measure the base of the peak - that is huge ground for uncertainty on DH estimation even with WDS.

Not sure what you mean by "perceived" Duane-Hunt. Can you show some us graphical examples?

Yes, I agree the 80 eV half base width offset applies more appropriately to 10 keV DH measurements, and yes, I look forward to trying that next.  But I won't be able to check the energy calibration using Ge Ka so I will use Zn Ka I guess.

I really appreciate your comments on this topic.  Can you share some of your own measurements of Duane-Hunt limit tests?
« Last Edit: February 02, 2024, 09:00:25 AM by John Donovan »
The only stupid question is the one not asked!

sem-geologist

  • Professor
  • ****
  • Posts: 302
Re: Duane-Hunt limit
« Reply #21 on: February 02, 2024, 03:27:05 AM »
Recently I just came across something so obvious and big (The really big Elephant in the room) that we could absolutely missed it in these attempts of precise DH estimation.

Let me quote a paragraph from Ritchie et al 2020 (Proposed practices for validating the performance of instruments used for automated inorganic gunshot residue analysis https://doi.org/10.1016/j.forc.2020.100252), section on Duane-Hunt limit  difference (4.1.3. Diagnosis), at point 1e we see this (emphasis is mine):
Quote
(c) The beam energy on some tungsten-filament SEMs is always a few hundred volts less than the set voltage due to a bias on the Wehnelt, a component of the electron gun assembly. A Duane-Hunt limit that is consistently low by a few hundred volts is not a problem so long as the over-voltage, U, on the lead L-lines is sufficient that they remain visible ( U > 1.5 20 keV/13.0 keV ).

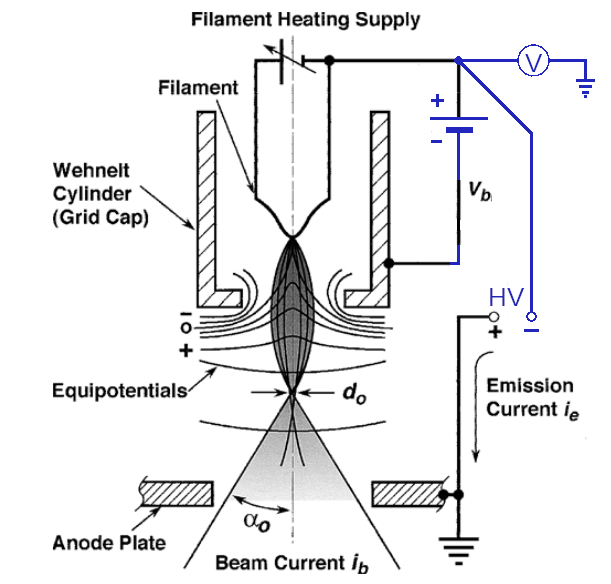
While context about Pb L-lines is not relevant for us here, what is relevant is bias on the Wehnelt. First of all Bias voltage can be not just few hundred of volts but up to over one thousand! Let me show some quick summary of bias provided by different commercial HV supplies (SEM/EPMA dedicated) (aggregated from publicly available datasheets from manufacturer sites):

Manufacturer; model(s) | Max bias (kV)
Matsusada; SEM-30 & SEM-15 3.5 kV
CPS; 3604 & 3603 2kV
SpellmanHV, EBM20N5/241.5kV (alt 2 kV)
SpellmanHV, EBM-TEG3.5 kV
SpellmanHV, EBM-TEGR1.65 kV

Operational bias depends a lot from geometry of W-hairpin and Wehnelt aperture assembly (i.e. diameter of aperture, thickness of W wire). In case of small Wehnelt aperture and close proximity to the W-wire, the bias voltage for proper operation will need to be small, where setting too huge bias would "pinch-off" the emission (it is over-generalization, and "pinch-off" is possible on some of designs and impossible on other. See below). On the other hand, if Wehnelt aperture is large, then 3kV of bias voltage could be just barely enough to get a beam crossover. All geometry/bias voltage approaches have it's pros and cons. But what matters for us here is actually how bias and acceleration voltage is regulated and I think it can be summarized in 3 possible types. The main emphasis there is how bias voltage difference is created, and where high voltage feedback is measured for regulation.

1. Classical

Pros: most simple
Cons: Voltage set and regulated on Wehnelt, voltage cathode (thus electron acceleration voltage, thus landing energy) always lower than set voltage.

Characteristics: fixed stable voltage, Bias voltage is regulated by regulating the resistance of bias resistor. 2 power transformers (heat, tension). Bias voltage is affected by emission current thus it has a minimal emission current limit thus which is not possible to go below and to pinch-off the emission.

2. Classical-alternative

Pros: still simple; Voltage is set and regulated on cathode
Cons: stability?

Characteristics: Bias is regulated by changing Resistance of Bias resistor, HV increases to compensate the voltage drop on the cathode, some limited possibilities for oscillations. 2 power transformers (heat, high tension). It has a minimal emission limit thus it is not possible to go below and pinch-off the emission.

3. Active Bias supply

Pros: Voltage of cathode is regulated independently from bias, It is possible to get smaller emission areas which would be not possible with resistive bias.
Cons: more complex built (3 power transformers instead of 2)

Characteristics: Bias is regulated independently from cathode voltage, bias is independent from emission - no self oscillation possible. It is possible to set bias voltage huge enough to "pinch-off" emission.

So Those SEM (and EPMA) which are affected by e) in quote from Ritchy'ies publication are some older generation instruments with type 1. HV supply.

At first glance Cameca SX100 HV tank is implemented like type 1. However it is not so very bad as cathode voltage can be calibrated for particular emission current, or tabulated and applied as corrections for different emission currents. Single potentiometer calibration in this case can help only temporary with single emission current, running with other emission currents than HV got calibrated with will provide some offset in read HV values from the tank. (I guess that is 100uA). The question is also if Cameca firmware does not do corrections behind the back (maybe thats why few year ago when set 15kV it was reporting 14.88kV?), and if Probe Software does not ignore that. Are Probe Software saving "setted" or "getted" HV values? or both? Which one is used in calculations?

Are someone familiar with HV system on Jeol (W-based) Probe? Could anyone comment which type it is?

I will soon share some DH limit experiments from our SXFiveFE. FE advantage is that it is more like type 3, thus I suspect the landing energy should be very close to the set voltage.
« Last Edit: February 02, 2024, 09:02:14 AM by John Donovan »

sem-geologist

  • Professor
  • ****
  • Posts: 302
Re: Duane-Hunt limit
« Reply #22 on: February 02, 2024, 06:09:10 AM »
It sure looks like the electron beam is more than 15 keV, whereas I would expect 15 keV or a smidgem less. Particularly since this is a carbon coated sample and from CalcZAF we should see a loss of about 8 eV for 20 nm of carbon and 15 keV electrons.
Just a small comment on that.

Coating layer should not slow down every beam electron, but only just some small portion of electrons, which gets into interaction with coating material atoms. Bremstrahlung radiation is due to electron acceleration or slowing down ( depends from space frame we are looking from, slowing down is negative acceleration looking from our space frame, or braking) - not because of direct interaction with the matter (albeit matter makes it possible to halt the electron in hard way, like near instant slow down, where electric field would do kind of soft continuous breaking (slowing down)). A fun fact: Bremstrahlung radiation is also generated near gun where electrons are accelerated (will generate kind of soft Bremstrahlung), near lenses where they are deflected. Unfortunately the German-originating name of this radiation meaning "braking" radiation brings in some mind-shortcuts and confusion, it should be called "acceleration radiation" or "inertia breaking radiation".

Here, I find this material quite complementing my understanding on Bremstrahlung:
https://physics.stackexchange.com/questions/186361/why-does-accelerating-electron-emits-photons
and especially this animated particle acceleration looks like a picture worth many thousand words:

The red dot represents a charged particle, where lines represent the field, the ripple in field is seen by us as some electromagnetic radiation.
Source and further explanations: http://www.tapir.caltech.edu/~teviet/Waves/empulse.html

DH limit depends on electron "completely" deaccelerating to halt in a single momentary step and for that some "hard" obstacle is required. While statistically carbon coating will influence the spectral distribution, the DH limit stays the same. It is only that denser matter has more chances to instantly stop the electron, than not dense matter (and thus the slope in the EDS approaching the DH limit of those are much more steeper compared to the light materials). Carbon coating for these kind of experiments actually help as it prevents the charge build up. Charge build up is much worse for precise DH estimation, as its electric field slows down every single electron in the beam approaching the surface (there should be increase in background at low energies when surface is charged) - then whole DH lowers down. There of course is few modes: a) unintentional surface charge by the beam electrons, when there is no well grounded electron return path or surface is not conductive - such charge tends to get into oscillations and thus as Ritchy mentioned DH will be highly dynamic.
And b) - intentional bias of surface charge potential - that is available on some new SEM - that is stage instead being connected to ground is connected to some bias voltage and so it would make well coated surface of sample to produce uniform negative or positive electric field which would increase or decrease the landing energy of all landing electrons. I still don't get complete understanding of its benefits, but I had not much opportunity to play around with that.
« Last Edit: February 02, 2024, 09:05:24 AM by John Donovan »

John Donovan

  • Administrator
  • Emeritus
  • *****
  • Posts: 3277
  • Other duties as assigned...
    • Probe Software
Re: Duane-Hunt limit
« Reply #23 on: February 02, 2024, 09:37:18 AM »
At first glance Cameca SX100 HV tank is implemented like type 1. However it is not so very bad as cathode voltage can be han HV got calibrated with will provide some offset in read HV values from the tank. (I guess that is 100uA).

This is fascinating reading, thank-you for documenting this.  I think your results from 10 keV LiF WDS measurements will be very interesting.  I was going to try this weekend, but the lab power may be down.

The question is also if Cameca firmware does not do corrections behind the back (maybe thats why few year ago when set 15kV it was reporting 14.88kV?), and if Probe Software does not ignore that. Are Probe Software saving "setted" or "getted" HV values? or both? Which one is used in calculations?

And here we thought we recorded everything!  Right now we are only utilizing the "set" HV values.  We will look into recording the "get" HV values also.

The problem I see is what do we believe in terms of the electron landing energy?  We don't know the accuracy of the set HV values, nor do we know the accuracy of the "read" HVC value.

The Duane-Hunt limit should help us to decide this.
John J. Donovan, Pres. 
(541) 343-3400

"Not Absolutely Certain, Yet Reliable"

Probeman

  • Emeritus
  • *****
  • Posts: 2839
  • Never sleeps...
    • John Donovan
Re: Duane-Hunt limit
« Reply #24 on: February 02, 2024, 11:27:20 AM »
Note also that even with the same coating on both standards and unknowns once can apply a "coating correction" in Probe for EPMA to account for the electron landing energy loss as described here:

https://probesoftware.com/smf/index.php?topic=23.msg1258#msg1258

This coating correction is in two parts, one for x-ray absorption which mainly affects low energy emission lines and another coating correction for electron energy loss, which really only matters at low overvoltages.
The only stupid question is the one not asked!

Probeman

  • Emeritus
  • *****
  • Posts: 2839
  • Never sleeps...
    • John Donovan
Re: Duane-Hunt limit
« Reply #25 on: February 10, 2024, 12:54:42 PM »
I meant you can also check the Duane-Hunt limit using WDS.  You can use any material. 

The common LiF [200], 2d of 4.0267 Angstroms, will cover out to about 13kV, at least on CAMECA WDS.  If you're fortunate enough to have an LiF [220], 2d of 2.848 Angstroms, you can get out to about 19kV.

Attached is an example at 10 kV beam voltage on Zr metal using LiF [200].  X-axis is plotted in HV.

Thank-you! 

This is a great suggestion (see my tests at 13 keV below) and I want to try again at 10 keV, but our instrument is down for the moment...

In the meantime can you explain how Cameca (or JEOL) handles the issue of bias voltage in calibrating the high voltage power supply to ensure that the electron landing energy takes the bias voltage offset into account?

Also do you know of any tests that can characterize the degree of electron energy spread in the electron beam? That is, how non monochromatic are our electron beams?
The only stupid question is the one not asked!

Nicholas Ritchie

  • Professor
  • ****
  • Posts: 141
    • NIST DTSA-II
Re: Duane-Hunt limit
« Reply #26 on: February 11, 2024, 06:53:07 AM »
Also do you know of any tests that can characterize the degree of electron energy spread in the electron beam? That is, how non monochromatic are our electron beams?

We know from electron energy loss spectroscopy (EELS) that the electron source is essentially monochromatic from the perspective of X-ray analysis.  Today, monochromated cold field emission beams are used which can produce beams with milli-eV energy spreads.  However, early EELS was performed with thermal sources which had resolutions on the order of 1 eV.  This is the number we should compare to.
« Last Edit: February 11, 2024, 09:04:34 AM by John Donovan »
"Do what you can, with what you have, where you are"
  - Teddy Roosevelt

Probeman

  • Emeritus
  • *****
  • Posts: 2839
  • Never sleeps...
    • John Donovan
Re: Duane-Hunt limit
« Reply #27 on: February 11, 2024, 09:02:33 AM »
We know from electron energy loss spectroscopy (EELS) that the electron source is essentially monochromatic from the perspective of X-ray analysis.  Today, monochromated cold field emission beams are used which can produce beams with milli-eV energy spreads.  However, early EELS was performed with thermal sources which had resolutions on the order of 1 eV.  This is the number we should compare to.

1 eV or less?  OK, that is good to know. So even tungsten electron sources, as used here:

https://probesoftware.com/smf/index.php?topic=1063.msg12312#msg12312

cannot seemingly explain the extent to which continuum seems to be produced past the assumed electron beam energy.  So that leaves the FWHM of the detector convolution and the gun bias voltage differential as other culprits...  assuming the high voltage supply is accurate of course!

I'm beginning to think that the Duane-Hunt limit test is more *limited* than we originally suspected!   :D
The only stupid question is the one not asked!

Probeman

  • Emeritus
  • *****
  • Posts: 2839
  • Never sleeps...
    • John Donovan
Re: Duane-Hunt limit
« Reply #28 on: February 11, 2024, 05:24:20 PM »
We know from electron energy loss spectroscopy (EELS) that the electron source is essentially monochromatic from the perspective of X-ray analysis.  Today, monochromated cold field emission beams are used which can produce beams with milli-eV energy spreads.  However, early EELS was performed with thermal sources which had resolutions on the order of 1 eV.  This is the number we should compare to.

Do you have any literature references for the thermal sources that you can share with us?
The only stupid question is the one not asked!

Probeman

  • Emeritus
  • *****
  • Posts: 2839
  • Never sleeps...
    • John Donovan
Re: Duane-Hunt limit
« Reply #29 on: February 12, 2024, 07:46:06 AM »
You can also measure the Duane-Hunt limit on WDS using a standard LiF, if you are using high voltages less than 13 kV.

For the SX100 and SX Five, the measured value read from the HV regulation board can be adjusted using R307.  This only affects the measured (feedback) value and doesn't change the gun voltage.

Carl,
How does Cameca ensure that the electron landing energy (high voltage power supply) is accurately calibrated?

On the Cameca Shallow Probe (which it appears they no longer manufacture?), because it is based on the principle of minimum overvoltage (for detection of trace elements in very thin films), it seems this would be a critically important calibration.  See product literature attached below.

This Shallow Probe high voltage power supply could apparently operate only at relatively low electron beam energies, e.g., "The EX-300 covers an implant energy range from a few hundred eV up to 5keV/10keV for Boron and up to 70keV for Phosphorus and Arsenic."  Also mentioned is "In LEXES, soft X-rays are generated by an electron beam, then analyzed by spectrometers. A special electron column was designed by CAMECA to deliver focused beam carrying high electron current at low impact energies (up to 30μA and down to 0.3 keV)."

So from 300 eV up to what?  What was the highest electron energy it could deliver?  And how was the gun electron voltage calibration accomplished?
« Last Edit: February 12, 2024, 08:32:56 AM by Probeman »
The only stupid question is the one not asked!