Author Topic: Using Probe for EPMA software in "demonstration mode" to teach EPMA  (Read 63014 times)

Probeman

  • Emeritus
  • *****
  • Posts: 2830
  • Never sleeps...
    • John Donovan
Re: Using Probe for EPMA software in "demonstration mode" to teach EPMA
« Reply #15 on: December 09, 2016, 08:49:49 AM »
Below is a comparison of scans across the Si Ka peak that I collected on "pure" Si using TAP and PETL crystals; I used the 550 and 500 micron detector slits, respectively.  I tend to leave the slits in the 500/550 micron position (tab lifted fully) over the long term because 1) I don't really like sticking the "screwdriver" into the spectrometers except for crystal alignments, 2) sometimes the tab doesn't lock securely into the desired position, and 3) this slit provides a good balance between resolution and count rate.  For Si Ka on PETL, I get FWHM = 2.34 eV, and, for Si Ka on TAP, I get FWHM = 6.78 eV.

Hi Brian,
Thanks. That seems very reasonable.

The good news is that because the Convolg code that comes with Penepma (which I am using to convolve these spectra), express FWHM as a function of energy, so as the energy of the spectrum increases (that is, Bragg angle gets smaller), the convolved resolution will correspondingly get worse just as one would expect in a Bragg spectrometer at lower angles, simply by using a constant for the resolution in the Convolg code.  :)
john
The only stupid question is the one not asked!

Probeman

  • Emeritus
  • *****
  • Posts: 2830
  • Never sleeps...
    • John Donovan
Re: Using Probe for EPMA software in "demonstration mode" to teach EPMA
« Reply #16 on: December 20, 2016, 12:42:02 PM »
By the way, I'm not sure if most people realize that when Probe for EPMA is in "demo" mode, and you have the demo EDS mode specified in the Probewin.ini file:

[hardware]
EDSSpectraInterfacePresent = 1
EDSSpectraInterfaceType = 0

Probe for EPMA will acquire EDS spectra (using Penepma running in the background), and display the actual EDS spectra calculated for the standard composition specified or a random composition for the unknown.   I think this could be useful for teaching, though at the moment one still has to utilize the Thermo or Bruker interface for obtaining net intensities for quantification (though we may have an "internal" spectrum peak stripping routine soon for quantification in demo mode).

See attached images below (you must be logged in to see attachments).
john
The only stupid question is the one not asked!

John Donovan

  • Administrator
  • Emeritus
  • *****
  • Posts: 3267
  • Other duties as assigned...
    • Probe Software
Re: Using Probe for EPMA software in "demonstration mode" to teach EPMA
« Reply #17 on: December 27, 2016, 11:57:39 AM »
I'm making progress on the Penepma WDS simulation mode in Probe for EPMA. The simulation is still quite crude so I'm not releasing it yet, but I think with another few days of work it will be ready to use by all.  Note that you will need to update your Penepma download before you can utilize the simulation feature.  I will announce when this Penepma update is ready to download.

Here (attached below- remember to login to see attachments!) are a couple examples of a simulated wavescan of the NIST K-411 minerals glass on a couple of spectrometers (TAP and LIF). Basically this merely tests the agreement between the NIST x-ray database and the Penepma x-ray database for the emission line energies (and my higher Bragg order reflections and refractive index correction calculations!).

But the resolution of the Fe Ka1 and Ka2 looks quite realistic to me!   I foresee a couple of benefits of this simulation mode:

1. Because Probe for EPMA has a very generous license (once one buys a copy for their instrument, all users of that instrument may copy the software on as many computers as they like for their own use), the software can be used to teach EPMA off-line without consuming time on the actual instrument.  My own lab manager has the students install the software on their laptops, and I have to say, when they show up for a lab practical, they already pretty much know how to run the instrument! 

This saves a lot of time (and money!).

2. Also, regular users and operators can create accurate analytical setups off-line, for example with off-peaks already adjusted to avoid off-peak interferences.  Be aware that because Penepma only calculates singly ionized atoms, no satellite emission lines will be visible in the simulated spectra, but the NIST KLM markers will still show their locations.

This could also save time (and money!).

OK, back to work!
john
John J. Donovan, Pres. 
(541) 343-3400

"Not Absolutely Certain, Yet Reliable"

John Donovan

  • Administrator
  • Emeritus
  • *****
  • Posts: 3267
  • Other duties as assigned...
    • Probe Software
Re: Using Probe for EPMA software in "demonstration mode" to teach EPMA
« Reply #18 on: December 30, 2016, 04:00:38 PM »
I need the favor of a sanity check.  I'm wondering if the Bragg crystals on my instrument are deteriorating also (for the higher order reflections).

In modeling the above WDS simulations based on Penepma spectra, I performed some scans on my Sx100.  Here is a scan of the NIST K-411 glass over the full range of a LTAP crystal:


For some reason I seem to remember that the higher order reflections were stronger when I got the instrument some 8 years ago. Does anyone have a similar scan on a mineral glass over the full range of a TAP spectrometer?  JEOL or Cameca flow detector, 15 keV, 4 sec per point, 2400 points.
« Last Edit: April 15, 2020, 09:15:35 AM by John Donovan »
John J. Donovan, Pres. 
(541) 343-3400

"Not Absolutely Certain, Yet Reliable"

John Donovan

  • Administrator
  • Emeritus
  • *****
  • Posts: 3267
  • Other duties as assigned...
    • Probe Software
Re: Using Probe for EPMA software in "demonstration mode" to teach EPMA
« Reply #19 on: December 30, 2016, 05:33:17 PM »
Another thought occurs to me: EDS detectors are usually at a fixed distance from the sample, but for WDS spectrometers, there is obviously a large decrease in geometric efficiency as the spectrometer is driven to high sin thetas and the distance to the sample increases.

That's a simple enough math problem, but there's a complication: the crystal is essentially perpendicular to the sample at high sin thetas, but tilts as it approaches the sample at lower sin thetas, therefore it presents a smaller area to the x-rays coming from the sample.  This is decrease in "aspect" geometric efficiency is inverse, compared to the increase in geometric efficiency from decreasing the distance to the sample at lower sin thetas.

I'm not sure how to calculate this change in geometric efficiency as a function of sin theta. Has anyone stumbled a cross a table or plot of this change in WDS geometric efficiency that I could use for my WDS simulation code?
john
« Last Edit: December 31, 2016, 10:26:18 AM by John Donovan »
John J. Donovan, Pres. 
(541) 343-3400

"Not Absolutely Certain, Yet Reliable"

John Donovan

  • Administrator
  • Emeritus
  • *****
  • Posts: 3267
  • Other duties as assigned...
    • Probe Software
Re: Using Probe for EPMA software in "demonstration mode" to teach EPMA
« Reply #20 on: December 31, 2016, 10:55:15 AM »
The coding for the WDS simulation is very interesting. For example, here is a calculated spectrum for a NIST mineral glass plotted in eV space for an LDE/PC crystal:


Looks weird right?  But if we plot this same spectrum as a function of sin theta and add some noise, as seen here:


It almost looks fairly correct. Here is the FWHM equation I had to use in the Penepma Convolg.f code (it could use an even larger exponent!):

C  ****  Example of FWHM(E) function for a WDS LDE spectrometer (~10 eV at 512 eV)
      FWHM=0.000000001D0*E**3.7

Here is an example of a K-412 glass simulated on a "JEOL" instrument for the different spectrometers (see attached images below).  I hope to be able to release this this weekend for general use though it still needs some tweaking to improve the modeling accuracy, e.g., non-linearity of the spectral resolution and geometric efficiency, etc.
john
« Last Edit: April 15, 2020, 09:15:55 AM by John Donovan »
John J. Donovan, Pres. 
(541) 343-3400

"Not Absolutely Certain, Yet Reliable"

John Donovan

  • Administrator
  • Emeritus
  • *****
  • Posts: 3267
  • Other duties as assigned...
    • Probe Software
Re: Using Probe for EPMA software in "demonstration mode" to teach EPMA
« Reply #21 on: December 31, 2016, 04:02:15 PM »
Ok, I got the WDS Penepma simulation working well enough I think for general use, though it still needs some tweaking as you will see.

First of all I should remind you that you will need to update Probe for EPMA (from the Help | Update Probe for EPMA menu) to v. 11.7.6 and also a second update of the Penepma files (also from the Help | Update Probe for EPMA menu, but be sure to check the Update Penepma Monte Carlo Files Only checkbox).

Second, there is no matrix (de)correction in these simulations yet, nor have I added Ar and Xe absorption edges from the detectors.

Third, Probe for EPMA will automatically revert back to the old demo mode, if any elements in the simulation have not yet been calculated. I've done about 2/3 of the pure elements so far (at 15 keV), but am continuing simulations of the remaining elements and also at 10 keV and 20 keV.

Fourth, Probe for EPMA will also utilize the WDS simulation data for off-peak measurements (the WDS simulation intensity scans are normalized to the calculated peak intensity, so they still work for quantification), but that means you can now get off-peak interferences in this new simulation mode!   ;D

So, let's compare some simulated scans to actual scans on my Sx100 instrument (15 keV, 30 nA, 4 seconds per point, 2400 points). First let's look at a TAP crystal on Mg2SiO4. Here is the experimental scan:


Now here is a simulated scan on Mg2SiO4:


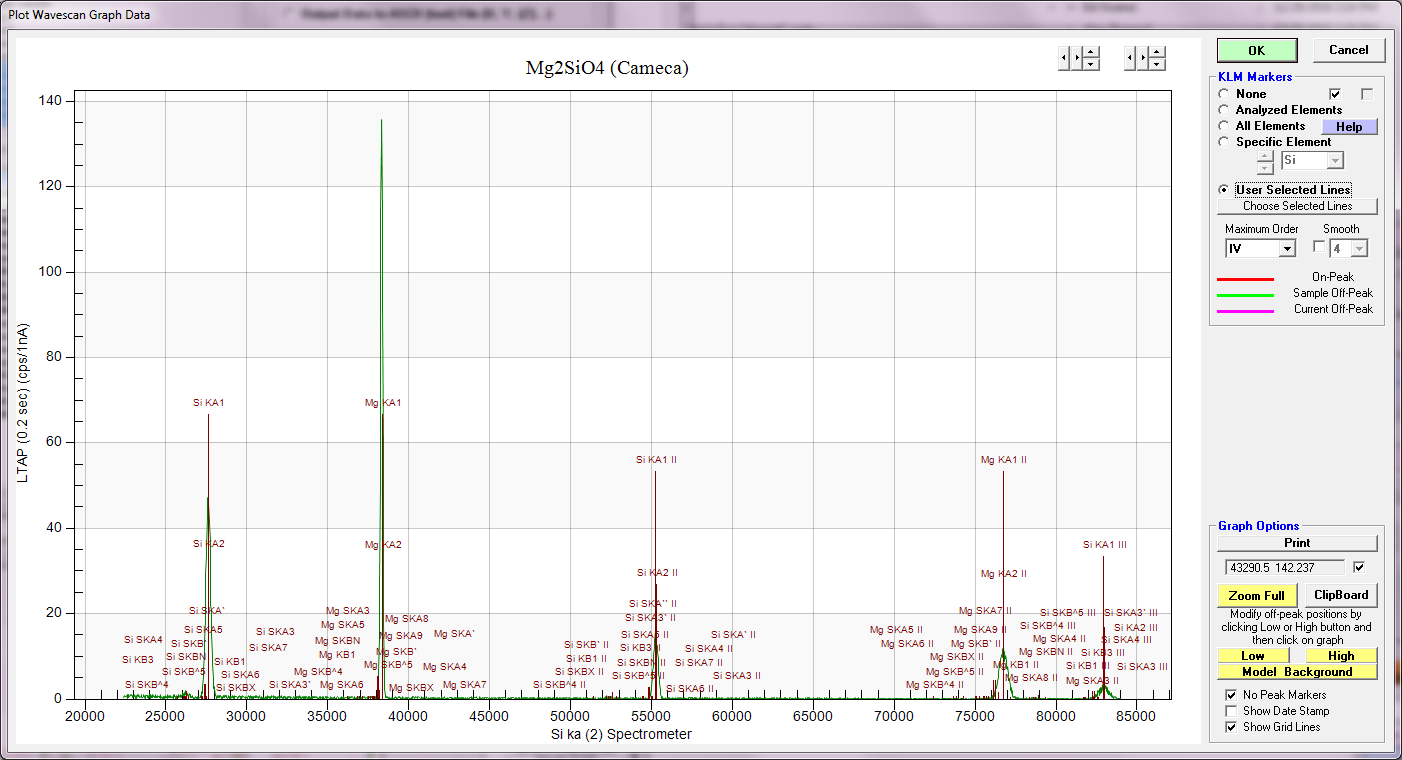
Not too bad!  Especially since I only "simulated" the scan at 0.2 seconds per point!

Yes, the tail shapes are wrong because the convolution software (Penepma/Convolg) only does a Gaussian convolution at the present time, but still not too bad!

I'll post some more examples in a bit, but Barb wants me to help with the New Year's Eve party preparations!   In the meantime I'll run the simulation at 4 seconds per point so the statistics are more comparable.
john
« Last Edit: April 15, 2020, 09:16:36 AM by John Donovan »
John J. Donovan, Pres. 
(541) 343-3400

"Not Absolutely Certain, Yet Reliable"

John Donovan

  • Administrator
  • Emeritus
  • *****
  • Posts: 3267
  • Other duties as assigned...
    • Probe Software
Re: Using Probe for EPMA software in "demonstration mode" to teach EPMA
« Reply #22 on: January 01, 2017, 12:41:25 PM »
Note that if for some reason you decide you don't want to utilize the new Penepma WDS simulation mode (for example, because you don't want to wait 10 to 30 seconds for the spectra simulation to be calculated), you can turn the Penepma spectrum simulation mode off (and/or back on) in the Acquire! window Acquisition Options dialog as seen here:


Note also that PFE doesn't re-calculate new spectra unless a different standard is selected, or the keV or analyzed (or specified) elements have changed, or it's an unknown or wavescan sample and no spectra have been calculated yet.

This means if you acquire a data point on a standard, PFE calculates new spectra for each analyzed element (unless it's the same standard). Then if you start a new unknown or wavescan sample, the program will utilize the previously calculated standard spectra for the subsequent unknown or wavescan acquisition.

If a standard spectra has not yet been calculated, PFE will calculate a spectrum based on a random composition using the current analyzed (and specified) elements.
« Last Edit: April 15, 2020, 09:17:11 AM by John Donovan »
John J. Donovan, Pres. 
(541) 343-3400

"Not Absolutely Certain, Yet Reliable"

John Donovan

  • Administrator
  • Emeritus
  • *****
  • Posts: 3267
  • Other duties as assigned...
    • Probe Software
Re: Using Probe for EPMA software in "demonstration mode" to teach EPMA
« Reply #23 on: January 01, 2017, 12:50:52 PM »
I should also mention that Probe for EPMA also utilizes this Penepma WDS simulation mode for the spectrometer peaking as seen here:


Here's a good joke you can play on an unsuspecting user: temporarily edit the probewin.ini file so the InterfaceType = 0 for demonstration mode and then let the student try to set up a probe run on the instrument!   ;D

See how long it takes them to realize that they're in simulation mode!   :P
john
« Last Edit: April 15, 2020, 09:17:24 AM by John Donovan »
John J. Donovan, Pres. 
(541) 343-3400

"Not Absolutely Certain, Yet Reliable"

John Donovan

  • Administrator
  • Emeritus
  • *****
  • Posts: 3267
  • Other duties as assigned...
    • Probe Software
Re: Using Probe for EPMA software in "demonstration mode" to teach EPMA
« Reply #24 on: January 01, 2017, 04:45:33 PM »
OK, here are some comparisons I promised between simulation and experimental. First here is a scan from my SX100 of the NIST K-411 glass on LIF:


Now a simulation:


Not too bad. Now a scan from my SX100 again on K-411 but of the PET crystal:


And again a simulation:


And here's the experimental and simulation without KLM markers:


I need to work a bit more on the peak widths and the intensities of the higher order reflections... and add Xe/Ar absorption edges.  But I think it's very usable for teaching.
john
« Last Edit: April 15, 2020, 09:18:03 AM by John Donovan »
John J. Donovan, Pres. 
(541) 343-3400

"Not Absolutely Certain, Yet Reliable"

John Donovan

  • Administrator
  • Emeritus
  • *****
  • Posts: 3267
  • Other duties as assigned...
    • Probe Software
Re: Using Probe for EPMA software in "demonstration mode" to teach EPMA
« Reply #25 on: January 03, 2017, 11:01:27 PM »
Here's an example of the new EDS and WDS simulation code running together in JEOL demo mode:


Sorry, I only had three WDS spectrometers running in this example!
john
« Last Edit: April 15, 2020, 09:18:20 AM by John Donovan »
John J. Donovan, Pres. 
(541) 343-3400

"Not Absolutely Certain, Yet Reliable"

John Donovan

  • Administrator
  • Emeritus
  • *****
  • Posts: 3267
  • Other duties as assigned...
    • Probe Software
Re: Using Probe for EPMA software in "demonstration mode" to teach EPMA
« Reply #26 on: January 06, 2017, 09:01:56 AM »
Here's an example of using the new WDS (off-line) simulation mode to find off-peak interferences.

Running a wavescan on a silicate standard we see the following graph in the Plot! window showing the K Ka III order line interfering with the default Mg ka off-peak position:


After clicking the new position for the high side off-peak:


I think this sort of thing could be useful for teaching EPMA off-line...
john

PS Here is a screen shot of the above run showing the WDS and EDS (and quant) simulation:

« Last Edit: April 15, 2020, 09:15:00 AM by John Donovan »
John J. Donovan, Pres. 
(541) 343-3400

"Not Absolutely Certain, Yet Reliable"

John Donovan

  • Administrator
  • Emeritus
  • *****
  • Posts: 3267
  • Other duties as assigned...
    • Probe Software
Re: Using Probe for EPMA software in "demonstration mode" to teach EPMA
« Reply #27 on: January 08, 2017, 05:29:02 PM »
This seems so obvious in hindsight and I really can't think of a reason why I didn't think of it before (except that I am a bit "slow of study"), but I just realized that we *can* implement an EDS quantification for the Penepma Monte Carlo EDS simulation in Probe for EPMA!

Yes, this method is not a peak stripping deconvolution method (though a colleague of ours is working on that, and still it's worth doing just to better teach the parameters involved in peak shape modeling!), but this implementation does allow students to perform integrated EDS and WDS (or just EDS!) quantification off-line in the classroom without an instrument.

What I just realized (smack on forehead!), is that by merely saving the net intensity results (in the pe-intens-01.dat file) from the Penepma simulation to a database table in PFE (and background intensities from the pe-bremss.dat file), I can simply match up the requested element by EDS to this already saved table and get the net intensity for that element!

Of course if you are actually on the instrument with a student, you would be utilizing the Thermo or Bruker EDS interface for getting your EDS net intensities, but this method works off-line on other computers for Penepma simulated EDS spectra. This means that every student in your probe class can perform these simulated EDS-WDS acquisitions and quantifications on their own laptops without wasting time on the actual instrument!

Pretty cool!   However, precision (actually poor accuracy due to low precision), is an issue with short EDS count times when using Penepma for Monte Carlo simulations.  It's a FORTRAN physics package that follows every photon for a full accounting of fluorescence effects... and remember, Monte Carlo simulation isn't as "productive" electron path-wise, as instrumental measurements from your lab!  Here is a comparison of the same Penepma simulation secondary standard acquired with 40 sec, 160 sec and 640 sec EDS counting times, and the resulting quant (the Mn and O are specified as fixed concentrations):

St  162 Set   2 NBS K-411 mineral glass, Results in Elemental Weight Percents
 
ELEM:       Si      Fe      Mg      Al      Ca      Mn       O   SUM
    20  30.713  11.209   9.329    .000   9.680    .077  43.558 104.566
    21  30.418  11.252   9.276    .000   9.621    .077  43.558 104.202

AVER:   30.565  11.231   9.303    .000   9.650    .077  43.558 104.384
SDEV:     .208    .030    .037    .000    .041    .000    .000    .257
SERR:     .147    .021    .026    .000    .029    .000    .000
%RSD:      .68     .27     .40     .29     .43     .00     .00

PUBL:   25.382  11.209   8.847    .053  11.057    .077  43.558 100.183
%VAR:    20.42     .19    5.15 -100.00  -12.72     .00     .00
DIFF:    5.183    .022    .455   -.053  -1.407    .000    .000
STDS:       14     160      12     160     160     ---     ---

Not great accuracy, but the Monte Carlo simulation only ran for 40 seconds! By the way, I'm not introducing any additional synthetic "noise" into these EDS calculations...  I'm storing but not yet utilizing the uncertainty values from the pe-intens-01.dat file...

Now again on the same secondary standard (both primary and secondary standards re-required with 160 sec Monte Carlo simulation time):

St  162 Set   3 NBS K-411 mineral glass, Results in Elemental Weight Percents
 
ELEM:       Si      Fe      Mg      Al      Ca      Mn       O   SUM
    30  25.712  11.636   7.662    .056  11.678    .077  43.558 100.380
    31  25.777  11.664   7.658    .056  11.582    .077  43.558 100.372

AVER:   25.745  11.650   7.660    .056  11.630    .077  43.558 100.376
SDEV:     .046    .020    .003    .000    .068    .000    .000    .006
SERR:     .032    .014    .002    .000    .048    .000    .000
%RSD:      .18     .17     .04     .09     .58     .00     .00

PUBL:   25.382  11.209   8.847    .053  11.057    .077  43.558 100.183
%VAR:     1.43    3.93  -13.41    5.13    5.19     .00     .00
DIFF:     .363    .441  -1.187    .003    .573    .000    .000
STDS:       14     160      12     160     160     ---     ---

Much better accuracy now with about a 160 sec (2.5 minute) simulation!

And here again with 640 sec simulation time (both primary and secondary standards "re-acquired"):

St  162 Set   4 NBS K-411 mineral glass, Results in Elemental Weight Percents
 
ELEM:       Si      Fe      Mg      Al      Ca      Mn       O   SUM
    40  26.027   9.965   8.763    .099  11.309    .077  43.558  99.798
    41  26.033   9.973   8.765    .099  11.311    .077  43.558  99.815

AVER:   26.030   9.969   8.764    .099  11.310    .077  43.558  99.807
SDEV:     .004    .005    .001    .000    .002    .000    .000    .012
SERR:     .003    .004    .001    .000    .001    .000    .000
%RSD:      .02     .05     .02     .02     .01     .00     .00

PUBL:   25.382  11.209   8.847    .053  11.057    .077  43.558 100.183
%VAR:     2.55  -11.06    -.94   86.34    2.29     .00     .00
DIFF:     .648  -1.240   -.083    .046    .253    .000    .000
STDS:       14     160      12     160     160     ---     ---

Fe is the least accurate, but that makes sense as it will be a lower intensity emission line at 15 keV.   Actually I'm impressed how good the quant is.  Normally we expect Penepma to take 10 to 20 hours for precision approaching that of a normal EPMA instrument. Limiting the minimum energy to 1 keV will help even more (but then one won't see the oxygen peak in the simulated spectra!).

Remember, to utilize this new EDS-WDS simulation and full quantification feature you will need to update PFE to v. 11.7.9 from the Help menu and then also update your Penepma files from the help menu (with the Update Penepma Monte Carlo Files Only checkbox checked).

I'd be very interested in what you all think.   Oh, by the way, in the throws of this simulation coding I implemented a method that allows one to specify different EDS (and CL) acquisition times for automation on a per sample basis. It even allows changing the EDS (and CL) count time on a per line basis with manually acquired samples.
john
John J. Donovan, Pres. 
(541) 343-3400

"Not Absolutely Certain, Yet Reliable"

John Donovan

  • Administrator
  • Emeritus
  • *****
  • Posts: 3267
  • Other duties as assigned...
    • Probe Software
Re: Using Probe for EPMA software in "demonstration mode" to teach EPMA
« Reply #28 on: January 09, 2017, 10:59:35 AM »
Last night I ran some EDS simulation acquisitions for 3600 sec each. Here is a quant from one of the secondary standards:

St  162 Set   1 NBS K-411 mineral glass, Results in Elemental Weight Percents
 
ELEM:       Si      Fe      Mg      Al      Ca      Mn       O
TYPE:     ANAL    ANAL    ANAL    ANAL    ANAL    SPEC    SPEC
BGDS:      EDS     EDS     EDS     EDS     EDS
TIME:  3600.00 3600.00 3600.00 3600.00 3600.00     ---     ---

ELEM:       Si      Fe      Mg      Al      Ca      Mn       O   SUM
    10  25.694  10.963   9.049    .059  10.831    .077  43.558 100.231
    11  25.706  10.952   9.046    .059  10.836    .077  43.558 100.235

AVER:   25.700  10.958   9.047    .059  10.834    .077  43.558 100.233
SDEV:     .009    .008    .002    .000    .003    .000    .000    .003
SERR:     .006    .006    .001    .000    .002    .000    .000
%RSD:      .04     .07     .02     .77     .03     .00     .00

PUBL:   25.382  11.209   8.847    .053  11.057    .077  43.558 100.183
%VAR:     1.25   -2.24    2.27   11.63   -2.02     .00     .00
DIFF:     .318   -.251    .200    .006   -.223    .000    .000
STDS:       14     160      12     160     160     ---     ---

As you can see, the accuracy is close to that from normal EDS measurements.  Note that I'm *not* suggesting that anyone needs to run their EDS simulations that long for teaching purposes, just that if you do, the accuracy is closer to what one would expect.

Next I modified the Penepma minimum energy in PFE from 400 eV to 1000 eV and ran the standards again. Here are results using 400 eV at 160 sec:

St  162 Set   7 NBS K-411 mineral glass, Results in Elemental Weight Percents
 
ELEM:       Si      Fe      Mg      Al      Ca      Mn       O
TYPE:     ANAL    ANAL    ANAL    ANAL    ANAL    SPEC    SPEC
BGDS:      EDS     EDS     EDS     EDS     EDS
TIME:   160.00  160.00  160.00  160.00  160.00     ---     ---

ELEM:       Si      Fe      Mg      Al      Ca      Mn       O   SUM
    67  25.771  11.891   7.673    .055  11.692    .077  43.558 100.716
    68  25.706  12.182   7.661    .055  11.353    .077  43.558 100.591

AVER:   25.738  12.036   7.667    .055  11.522    .077  43.558 100.654
SDEV:     .046    .206    .009    .000    .240    .000    .000    .088
SERR:     .033    .146    .006    .000    .170    .000    .000
%RSD:      .18    1.71     .11     .10    2.08     .00     .00

PUBL:   25.382  11.209   8.847    .053  11.057    .077  43.558 100.183
%VAR:     1.40    7.38  -13.34    3.53    4.21     .00     .00
DIFF:     .356    .827  -1.180    .002    .465    .000    .000
STDS:       14     160      12     160     160     ---     ---

And here are results using the same 160 sec counting (simulation) time, but with the minimum energy set to 1000 eV (1 keV):

St  162 Set   8 NBS K-411 mineral glass, Results in Elemental Weight Percents
 
ELEM:       Si      Fe      Mg      Al      Ca      Mn       O
TYPE:     ANAL    ANAL    ANAL    ANAL    ANAL    SPEC    SPEC
BGDS:      EDS     EDS     EDS     EDS     EDS
TIME:   160.00  160.00  160.00  160.00  160.00     ---     ---

ELEM:       Si      Fe      Mg      Al      Ca      Mn       O   SUM
    75  25.163  11.396   8.323    .062  11.595    .077  43.558 100.174
    76  25.169  11.396   8.323    .062  11.595    .077  43.558 100.181

AVER:   25.166  11.396   8.323    .062  11.595    .077  43.558 100.178
SDEV:     .005    .000    .000    .000    .000    .000    .000    .005
SERR:     .003    .000    .000    .000    .000    .000    .000
%RSD:      .02     .00     .00     .00     .00     .00     .00

PUBL:   25.382  11.209   8.847    .053  11.057    .077  43.558 100.183
%VAR:     -.85    1.67   -5.92   17.73    4.87     .00     .00
DIFF:    -.216    .187   -.524    .009    .538    .000    .000
STDS:       14     160      12     160     160     ---     ---

Obviously, this sort of statistical testing requires many more replicates, but it seems reasonable that by merely setting the Penepma minimum electron energy to 1.0 (keV) in the Probewin.ini file, one can get better accuracy with the Penepma EDS simulation in PFE.  Of course, the downside is that you won't see any peaks less than 1 keV (e.g., O Ka), but for teaching purposes it might suffice, especially for "geological" simulations where one isn't measuring oxygen anyway!

Right now changing this Penepma Minimum Electron Energy value requires an edit of the value in the Probewin.ini file, but in the next update later this week, I will add this field to the Acquisition Options dialog so it can be edited during a "run"...
john
« Last Edit: January 09, 2017, 02:14:07 PM by John Donovan »
John J. Donovan, Pres. 
(541) 343-3400

"Not Absolutely Certain, Yet Reliable"

John Donovan

  • Administrator
  • Emeritus
  • *****
  • Posts: 3267
  • Other duties as assigned...
    • Probe Software
Re: Using Probe for EPMA software in "demonstration mode" to teach EPMA
« Reply #29 on: January 09, 2017, 10:07:54 PM »
Here's the new Penepma WDS and EDS simulation parameters in the Acquisition Options dialog:


I also updated the Penepma distribution to include more pure element spectra for WDS simulation, so feel free to update your Penepma files again from the Help menu.
john
« Last Edit: April 14, 2020, 12:46:52 PM by John Donovan »
John J. Donovan, Pres. 
(541) 343-3400

"Not Absolutely Certain, Yet Reliable"