Hi all,
I'm not sure if this topic has been discussed elsewhere in the forum, but does anyone know if there has been any systematic study on the suitability of using NIST/NBS steel standards as microprobe standards, i.e. homogeneity of them at microscale? I understand the composition of most of the commercial available ones were based on bulk chemical analysis method. what is your experience with them?
Many thanks already.
Jeff
Hi Jeff,
There is nothing systematic about the data below, but I threw a couple of NIST alloy SRMs that I had already mounted into the instrument over the weekend and run a bunch of elements on both. The data looks pretty good but I wasn't able to run a second set of standards for a drift correction as the filament blew during the last traverse.
I suspect the answer to your question is going to be "it depends". That is it depends on which SRM standards we are talking about. Here is the the first one I ran which is a NiFe alloy, SRM 1159 to be exact. First the major elements:
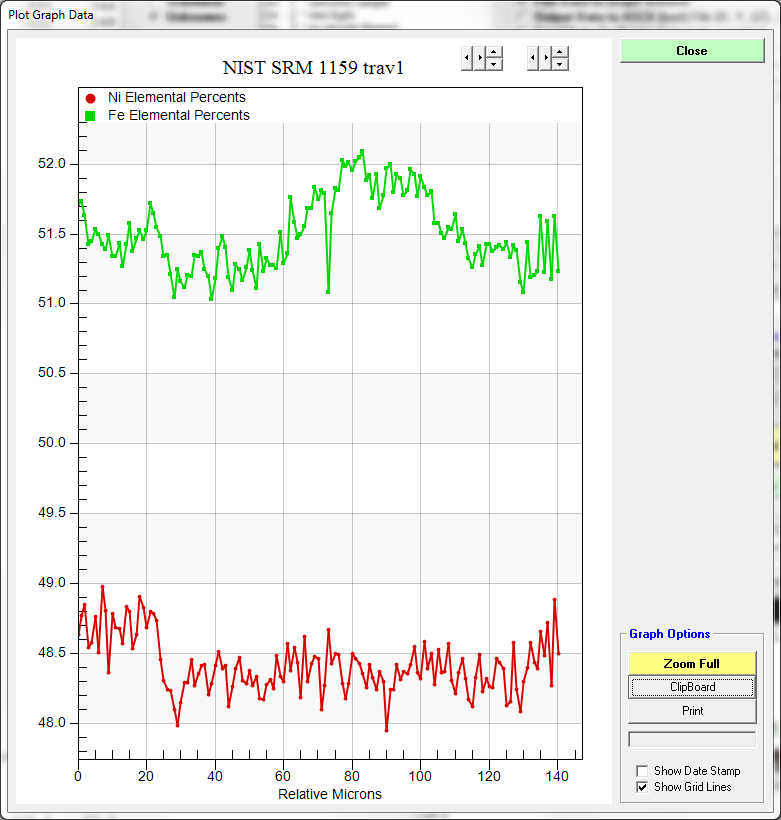
Note that the Fe appears to vary a little, but according to the homogeneity range calculations below, the Fe is homogeneous within the 1% precision confidence interval. The minor and trace elements look like this:

Clearly the Cu is *not* homogeneous, but the others look pretty good.
Finally I turned on the Homogeneity Range calculations from the Calculation Options dialog in the PFE Analyze! window and we get this output:
Range of Homogeneity (t-test) in +/- Elemental Weight Percent (Average of Sample):
ELEM: Ni Mo Cr Fe W Co Si Mn V Cu O
60ci .013 .000 .000 .017 --- .000 .001 .001 .000 .008 .000
80ci .021 .000 .000 .026 --- .000 .001 .001 .000 .012 .001
90ci .026 .000 .000 .034 --- .000 .001 .001 .000 .016 .001
95ci .032 .000 .000 .040 --- .000 .001 .001 .000 .019 .001
99ci .042 .000 .000 .053 --- .000 .002 .002 .000 .025 .001
Test of Homogeneity (t-test) at 1.0 % Precision (Average of Sample):
ELEM: Ni Mo Cr Fe W Co Si Mn V Cu O
60ci yes yes yes yes --- yes yes yes yes no yes
80ci yes yes yes yes --- yes yes yes yes no yes
90ci yes yes yes yes --- yes yes yes yes no yes
95ci yes yes yes yes --- yes yes yes yes no yes
99ci yes no yes yes --- yes yes yes yes no yes
Level of Homogeneity (t-test) in +/- Percent (Average of Sample):
ELEM: Ni Mo Cr Fe W Co Si Mn V Cu O
60ci .0 .4 .2 .0 --- .1 .2 .2 .1 1.3 .2
80ci .0 .6 .4 .1 --- .2 .2 .2 .1 2.0 .3
90ci .1 .8 .5 .1 --- .2 .3 .3 .2 2.6 .4
95ci .1 .9 .6 .1 --- .3 .4 .4 .2 3.1 .4
99ci .1 1.2 .8 .1 --- .4 .5 .5 .3 4.0 .6
Range of Ideal Homogeneity (t-test) in +/- Elemental Weight Percent (Average of Sample) (Meisenkothen and Donovan):
ELEM: Ni Mo Cr Fe W Co Si Mn V Cu O
60ci .095 .000 .002 .050 --- .000 .006 .006 .000 .004 .001
80ci .145 .001 .003 .077 --- .000 .009 .010 .000 .007 .002
90ci .187 .001 .004 .099 --- .001 .011 .012 .000 .009 .003
95ci .223 .001 .005 .118 --- .001 .013 .015 .000 .010 .003
99ci .294 .001 .006 .155 --- .001 .018 .020 .000 .014 .005
Range of Actual Homogeneity (t-test) in +/- Elemental Weight Percent (Average of Sample) (Meisenkothen and Donovan):
ELEM: Ni Mo Cr Fe W Co Si Mn V Cu O
60ci .160 .000 .002 .205 --- .000 .006 .007 .000 .097 .005
80ci .244 .001 .003 .313 --- .001 .010 .010 .000 .148 .008
90ci .313 .001 .004 .402 --- .001 .012 .013 .000 .190 .010
95ci .374 .001 .004 .480 --- .001 .015 .016 .000 .227 .012
99ci .494 .002 .006 .635 --- .001 .020 .021 .000 .300 .016
Next I will look at SRM C2402, which is a very different story!


 We depend on your feedback and ideas!