Author Topic: New TDI Scanning For Beam Sensitive Samples  (Read 10648 times)

John Donovan

  • Administrator
  • Emeritus
  • *****
  • Posts: 3277
  • Other duties as assigned...
    • Probe Software
New TDI Scanning For Beam Sensitive Samples
« on: March 30, 2017, 06:14:30 PM »
You all may remember that I first tried the idea of replicate scanning using short pixel dwell times in an attempt to correct for carbon contamination, as posted here last month:

http://probesoftware.com/smf/index.php?topic=41.msg5650#msg5650

Surprisingly, using a pixel by pixel TDI correction seemed to do a fairly reasonable job!  Though more testing is obviously required.

I promised at that time to do a similar TDI scan on a beam sensitive sample... in order to deal with the problem that if one uses a dwell time long enough for decent precision, beam sensitive samples can be adversely affected even when utilizing a stage scan with pixel dwell times of only 2 secs, as originally posted here in 2014:

http://probesoftware.com/smf/index.php?topic=144.msg583#msg583

So this week I ran some replicate stage scan maps on an alkali rich melt inclusion from one of our geologists, and I have to tell you that I got some results that were rather surprising.  I might guess what could be going on, but still I am quite surprised at the quantification results. I'd be very interested in hearing what you all think might be happening here...

So because I wanted to avoid the obvious beam damage as shown in the melt inclusion scan from 2014 linked above, I decided to use a pixel dwell time of only 0.1 sec per pixel and acquire 5 replicate scans for a total acquisition time of 0.5 secs per pixel. I should have run more replicate scans for a full 2 secs per pixel but I was impatient to see some results! Here are the K and Na raw intensity maps and to my *initial* disappointment I found that we still see the "grid" pattern in the Na and K raw data (15 keV, 30 nA), though this beam damage/ion migration artifact (it must be a resonant ion migration right?) is much less than we saw in the original scan I did in 2014 (which was acquired using a single scan of 2000 ms per pixel).


So far so good, though I accidentally processed the data with my software in JEOL mode so that is why the x and y coordinates don't look Cameca-ish!  So I utilized the new Convert Replicate PrbImg Files To TDI menu in CalcImage as described in the first link above to sum the replicate scans and copy them to the \TDI sub folder.  After manually copying in the 2nd pass elements (I ran 5 replicate scans for the first pass elements and a single scan for the 2nd pass trace elements using a longer dwell time) into the \TDI folder, I then created a new CalcImage project using the Create (new) Project Wizard menu in CalcImage as usual.

Before I ran the map quantification I first took a look at the Na channel in the Standard Assignments button and here you can see that there are basically two trends.  One for the pixels in the glass melt inclusion and another set in the quartz host mineral.  Here is a plot looking at every 512th pixel:


And here is the quantification *without* the TDI correction:


In the next post we'll have the same data but quantified *with* the TDI correction...
« Last Edit: April 14, 2020, 12:12:56 PM by John Donovan »
John J. Donovan, Pres. 
(541) 343-3400

"Not Absolutely Certain, Yet Reliable"

John Donovan

  • Administrator
  • Emeritus
  • *****
  • Posts: 3277
  • Other duties as assigned...
    • Probe Software
Re: New TDI Scanning For Beam Sensitive Samples
« Reply #1 on: March 30, 2017, 06:16:16 PM »
And as promised, here is the same data but this time quantified *with* the TDI correction:


What the heck?  How did that happen...?

I mean I know that the TDI scanning correction is on a pixel by pixel basis, but this acquisition (for the 5 replicate scans of 200 x 200 pixels) took around 4 hours for the first 5 elements.  You know what this means?  It means the alkali ion migration is essentially permanent and this darn TDI scanning correction might actually work!
« Last Edit: April 14, 2020, 11:56:12 AM by John Donovan »
John J. Donovan, Pres. 
(541) 343-3400

"Not Absolutely Certain, Yet Reliable"

John Donovan

  • Administrator
  • Emeritus
  • *****
  • Posts: 3277
  • Other duties as assigned...
    • Probe Software
Re: New TDI Scanning For Beam Sensitive Samples
« Reply #2 on: March 31, 2017, 08:38:09 AM »
In case any one is interested in seeing how the so called "grid" pattern appears in an alkali glass here are the 5 replicate frames acquired at 100 ms per pixel:


What's really cool is that because the feature in the lower right seems to remain constant in intensity, one can observe that the Na concentration decreases in each replicate scan, which is borne out by observing that in the non-TDI quant plots the Na2O concentrations are around only 1.5 %, while in the TDI corrected quant scan the Na2O concentrations are closer to 4 wt%.  Considering that the dwell time per pixel was only 100 ms, that's a very beam sensitive sample!

(note that the above images are flipped because the images are in JEOL mode and Windows doesn't "speak" JEOL!) 

Could the grid pattern we see in these images be a result of slight (but reproducible) differences in the stage scanning speed?  I ask because when I looked at the SE image I see this (they look very similar in "wavelength" don't they?):


That is the "grid" pattern shows over the whole image, not just the glass inclusion...
john
« Last Edit: April 14, 2020, 11:26:34 AM by John Donovan »
John J. Donovan, Pres. 
(541) 343-3400

"Not Absolutely Certain, Yet Reliable"

Probeman

  • Emeritus
  • *****
  • Posts: 2839
  • Never sleeps...
    • John Donovan
Re: New TDI Scanning For Beam Sensitive Samples
« Reply #3 on: March 31, 2017, 11:54:23 AM »
In case any one is interested in seeing how the so called "grid" pattern appears in an alkali glass here are the 5 replicate frames acquired at 100 ms per pixel:


They are flipped because the images are in JEOL mode and Windows doesn't "speak" JEOL!).  Could the grid pattern we see (looks very similar in "wavelength" doesn't it) be a result of slight (but reproducible) differences in the stage scanning speed? 

Ben Hanson has an interesting hypothesis:

Quote
I have seen strange alkali loss phenomenon when I do focused line scans with small step sizes (step-count-step-count).  It's almost as though you are "pushing" alkali in front of the beam.  The alkalis are "chasing" electrons not only in to the sample but to the sides.  I always imagined that you build up alkali in front of the beam and then it reaches a condition where it is no longer mobile and the beam jumps over the piled up alkali and starts all over again.  I know.....I have a vivid imagination, but this phenomenon is weird.

I imagine that such a "build-up" and "jumping over the piled up alkali" could also occur for the continuous scans I ran for these melt inclusions...  but why would the 5 replicate scans show the same pattern? Because once the "piling up" occurs, it tends to only get worse with each replicate scan? ???
john
« Last Edit: April 13, 2020, 10:28:34 PM by John Donovan »
The only stupid question is the one not asked!

John Donovan

  • Administrator
  • Emeritus
  • *****
  • Posts: 3277
  • Other duties as assigned...
    • Probe Software
Re: New TDI Scanning For Beam Sensitive Samples
« Reply #4 on: March 31, 2017, 12:50:40 PM »
My only disappointment is that above the melt inclusion shows no compositional variation within the inclusion, unlike the inclusion from 2014 that we first linked to above.

In any case, because I don't trust myself (as Richard Feynman famously said: "the first rule in science is not to fool yourself, and you are the easiest person to fool!"), so I ran a second scan on another melt inclusion as seen below. First the raw intensities:


This next melt inclusion acquisition utilized 8 replicate scans of 0.05 secs (50 ms) per pixel for a total dwell time of 0.4 secs per pixel. Note that the Na channel still shows the so called "grid" pattern, though in the K channel the pattern is less obvious.  Now here are the x-rays maps quantified with the TDI scanning correction:


The "grid" pattern appears to be corrected, though it is hard to see in the Na map (the TDI correction appears to have created a few "hot"pixels in the quartz that bias the Na scaling), so I plotted everything as log wt.% and that shows that indeed the beam damage/ion migration has been corrected quite nicely using the new TDI scanning feature in CalcImage:


OK, I am really convinced. Now to find some melt inclusions with compositional variation!
« Last Edit: April 13, 2020, 10:01:30 PM by John Donovan »
John J. Donovan, Pres. 
(541) 343-3400

"Not Absolutely Certain, Yet Reliable"

Probeman

  • Emeritus
  • *****
  • Posts: 2839
  • Never sleeps...
    • John Donovan
Re: New TDI Scanning For Beam Sensitive Samples
« Reply #5 on: April 02, 2017, 10:37:35 AM »
Ben Hanson has an interesting hypothesis:

Quote
I have seen strange alkali loss phenomenon when I do focused line scans with small step sizes (step-count-step-count).  It's almost as though you are "pushing" alkali in front of the beam.  The alkalis are "chasing" electrons not only in to the sample but to the sides.  I always imagined that you build up alkali in front of the beam and then it reaches a condition where it is no longer mobile and the beam jumps over the piled up alkali and starts all over again.  I know.....I have a vivid imagination, but this phenomenon is weird.

I imagine that such a "build-up" and "jumping over the piled up alkali" could also occur for the continuous scans I ran for these melt inclusions...  but why would the 5 replicate scans show the same pattern? Because once the "piling up" occurs, it tends to only get worse with each replicate scan? ???
john

I wonder if this "grid" pattern we see in the above TDI scanning map intensities is related to the sinusoidal TDI intensities that George Morgan and Mike Jercinovic have previously pointed out?  I've also seen such sinusoidal variation in TDI intensities in my point TDI acquisitions, but I have no idea what was going on...

Here is a TDI point acquisition for Th Ma in a monazite sample (from Jercinovic):


So perhaps stage scanning speed has nothing to do with this "grid" pattern effect we are seeing and it simply a question of electron dose and time, as Ben Hanson has suggested?   Except that with the point sinusoidal effect (as seen in this post), there is no movement of the interaction volume within the samples, as there is for the TDI scanning maps...
john
« Last Edit: April 13, 2020, 09:43:30 PM by John Donovan »
The only stupid question is the one not asked!

Probeman

  • Emeritus
  • *****
  • Posts: 2839
  • Never sleeps...
    • John Donovan
Re: New TDI Scanning For Beam Sensitive Samples
« Reply #6 on: April 14, 2017, 04:35:10 PM »
I note that the latest version of CalcImage now automatically copies your analog signal (BSE, SE, etc) GRD files over to the \TDI folder (along with the x-ray maps) when the File | Convert Replicate PrbImg Files To TDI menu is utilized from the CalcImage Log Window.
john
« Last Edit: April 14, 2017, 09:48:01 PM by Probeman »
The only stupid question is the one not asked!

Probeman

  • Emeritus
  • *****
  • Posts: 2839
  • Never sleeps...
    • John Donovan
Re: New TDI Scanning For Beam Sensitive Samples
« Reply #7 on: April 19, 2017, 04:16:12 PM »
I found some time to perform some TDI tests on the NIST SRM K-1718 glass this week. The results are quite interesting. This very beam sensitive glass has the following composition:

St  171 K-1718 NBS Glass
ELEM:       Na      Fe      Ca      Si       O   SUM 
ELWT:   14.837  10.491   3.574  28.048  43.050 100.000
OXWT:   20.000  13.497   5.000  60.005   1.498 100.000
ATWT:   13.994   4.073   1.933  21.655  58.344 100.000

It is extremely beam sensitive as seen here for 4 points at 15 keV, 20 nA and a focused beam (not conditions that you'd ever actually want to use on such a beam sensitive glass!),  *without* the TDI correction:

ELEM:       Na      Fe      Ca      Si       O   SUM 
   172   1.520  11.998   4.152  32.958  43.175  93.803
   173   1.510  11.834   4.163  33.229  43.438  94.173
   174   1.464  12.018   4.140  33.066  43.279  93.967
   175   1.476  11.968   4.121  33.090  43.289  93.944

AVER:    1.492  11.955   4.144  33.086  43.295  93.972
SDEV:     .027    .083    .018    .112    .108    .153

And here *with* the TDI correction:

ELEM:       Na      Fe      Ca      Si       O   SUM 
   172  12.041  11.829   4.123  29.705  43.069 100.766
   173  10.939  11.535   4.290  30.546  43.626 100.936
   174  11.680  11.941   4.142  30.161  43.503 101.428
   175  13.549  11.973   4.188  30.941  45.069 105.720

AVER:   12.052  11.819   4.186  30.338  43.817 102.213
SDEV:    1.098    .200    .075    .529    .868   2.355
TDI%:  764.770  -1.458   1.261 -11.770     ---
DEV%:      3.3      .6     1.0      .2     ---

Note the TDI correction of over 700% for Na!  The TDI plot looks like this:


Note that this is a *double* exponential (both intensity and time axes!). 

Now for mapping. Again 15 keV, 20 nA, 0 um beam size and 100 msec per pixel using 1 um pixels. Here is the raw intensities for the 4 elements I measured (Si, Fe, Ca and Na):


Note the alkali ion migration in the raw Na intensity maps.  Now here it is quantified using the new TDI Scanning feature in Probe for EPMA/CalcImage:


The average results are shown here:


The TDI mapping produced more accurate results than the point analyses even though the total time per pixel was only .5 sec. Here are the TDI plots for the x-ray maps (every 256th pixel):


I find it interesting that the TDI curvature is so different from the point analysis above.
john
« Last Edit: April 13, 2020, 07:09:01 PM by John Donovan »
The only stupid question is the one not asked!

John Donovan

  • Administrator
  • Emeritus
  • *****
  • Posts: 3277
  • Other duties as assigned...
    • Probe Software
Re: New TDI Scanning For Beam Sensitive Samples
« Reply #8 on: April 21, 2017, 09:04:25 AM »
As you know, TDI point analyses display a number of TDI fit parameters in Probe for EPMA as shown here:

ELEM:       Na      Fe      Ca      Si       O   SUM 
   208  14.643  10.321   3.802  28.711  42.282  99.758
   209  14.711  10.788   3.838  29.091  42.887 101.315
   210  15.123  10.710   3.728  28.991  42.851 101.404
   211  13.979  10.394   3.872  28.746  42.140  99.130

AVER:   14.614  10.553   3.810  28.885  42.540 100.402
SDEV:     .474    .230    .061    .186    .385   1.136

TDI%:   53.503  -3.738  -2.765  -4.833     ---                  percent relative TDI correction (what is displayed below in the maps)
DEV%:       .4      .7     1.3      .2     ---                  percent TDI fit deviation
TDIF:  HYP-EXP LOG-LIN LOG-LIN LOG-LIN     ---                  TDI fit type
TDIT:   105.75  104.25  105.75  106.00     ---                  total TDI acqusition time
TDII:     203.    65.1    29.1    427.     ---                  TDI intensity zero intercept (cps per nominal beam)
TDIL:     5.31    4.18    3.37    6.06     ---                  TDI intensity zero intercept (log cps per nominal beam)

But for TDI scanning data (in CalcImage) we have no equivalent summary of the TDI fit parameters (until now).  Then Anette von der Handt pointed out to me that we could at least display the TDI correction for each pixel as a map...


I think it is very cool that we can now see how the "grid" TDI effect in the quant Na and K maps are corrected for on a pixel by pixel basis.

Basically if you are calculating TDI scanning corrections for x-ray maps, CalcImage will now automatically calculate and save TDI correction percent maps as GRD files. One will need to open them (from the File | Open menu), and then utilize the Output Currently Displayed Images menu in CalcImage for output to Surfer.

For these maps, because the host quartz pixels have concentrations of Na and K close to zero, the percent TDI corrections can be very large due to statistics, so for the maps above I set the max Z to values that better show the TDI corrections within the melt inclusion.

But what about Si Ka?


I find it interesting that the TDI correction size for Si ka are similar for both the quartz host and the ryolite melt inclusion- except for the edge artifacts, which are undoubtedly effects from the beam overlapping on both compositions, but why do the TDI corrections in these edge pixels seem to show a spectrometer orientation effect (spectro 4 on the Cameca is oriented in the lower left)?

For example, in the quant maps, Si (in the upper right of the image below) shows distinct edge effects, but no apparent spectrometer orientation effect...  or maybe the TDI edge artifact trend (above) is due to the direction of the slow scan which on the Cameca is from top to bottom...


Maybe it's got nothing to do with either the spectrometer orientation or the slow scan direction, but any other ideas?
john
« Last Edit: April 13, 2020, 08:45:16 AM by John Donovan »
John J. Donovan, Pres. 
(541) 343-3400

"Not Absolutely Certain, Yet Reliable"

Ben Buse

  • Professor
  • ****
  • Posts: 488
Re: New TDI Scanning For Beam Sensitive Samples
« Reply #9 on: July 04, 2017, 03:10:20 AM »
I ran some tests on rhyolite glass. I was intrigued by the question does many pixels each with short dwell times increase the error on tdi. Are you better with fewer larger pixels each with longer dwell time?

To test I ran a map on rhyolite glass calculated - 4 times - tdi_1,2,3,4. Then I took the average intensity of 45x45 pixels for 1,2,3,4 (corresponding to 80,160,240,360 millisecs) and calculated the TDI corrected value.

Separately for each pixel I calculated the TDI corrected value. Then I averaged the TDI corrected value for the 45x45 pixels.

I found: The map averaged TDI value = the average of individual pixel TDI values. Therefore the size of the bin in calculating the TDI correction does not matter.


Ben Buse

  • Professor
  • ****
  • Posts: 488
Re: New TDI Scanning For Beam Sensitive Samples
« Reply #10 on: July 04, 2017, 03:44:50 AM »
I was just looking what the raw intensity map is; its the average of the tdi maps. Or what you would get if you didn't apply TDI.

Probeman

  • Emeritus
  • *****
  • Posts: 2839
  • Never sleeps...
    • John Donovan
Re: New TDI Scanning For Beam Sensitive Samples
« Reply #11 on: July 04, 2017, 08:23:56 AM »
I was just looking what the raw intensity map is; its the average of the tdi maps. Or what you would get if you didn't apply TDI.

Hi Ben,
That is correct. For each raw intensity scanning TDI x-ray map, I simply sum all the acquired replicate maps, during the Create New Project Wizard process.  The slope calculated from the replicate map pixels is then applied to the raw intensity maps for the TDI correction.

This is the same procedure we do for the point analysis TDI corrections, where we sum the "sub-intervals" counts for the stored raw intensity, but for x-ray maps we do it for every pixel.
john
« Last Edit: July 04, 2017, 09:14:27 AM by Probeman »
The only stupid question is the one not asked!

Anette von der Handt

  • Global Moderator
  • Professor
  • *****
  • Posts: 351
    • UMN Probelab
Re: New TDI Scanning For Beam Sensitive Samples
« Reply #12 on: July 20, 2017, 01:54:54 PM »
Hi,

John and I will have a late breaking poster on TDI scanning at the M&M conference in St.Louis this year. Please come by the poster (Monday afternoon) if you would like to see and discuss more.

I attached the full abstract but here is one of the examples that we will show that demonstrates the power of TDI corrections on determining sodium concentrations in very beam-sensitive materials, here Corning Archeological Reference Glass 'A' (14.30 wt%Na2O). A combined dwell time of 5 seconds per pixel results readily in a 70 percent loss of Na2O at 15kV, 30nA and focused beam. With TDI scanning on the other hand, we get excellent agreement to the published values.


Map of Na2O (wt%) in Corning Archeological Reference Glass 'A', without TDI correction (left) and with TDI correction (right). Note the beam damage spots from previous analyses. Element compositions extracted from each map and the published reference value from Vicenzi et al (2002) are listed below.
« Last Edit: April 12, 2020, 10:03:10 PM by John Donovan »
Against the dark, a tall white fountain played.

John Donovan

  • Administrator
  • Emeritus
  • *****
  • Posts: 3277
  • Other duties as assigned...
    • Probe Software
Re: New TDI Scanning For Beam Sensitive Samples
« Reply #13 on: March 07, 2020, 09:23:43 AM »
Julien Allaz was plotting up some TDI trends in his quantitative x-ray maps using the TDI scanning feature and pointed out that the default number of pixels to plot are all powers of 2.

This is actually sort of a bad idea because if ones map pixel dimensions are also a power of two, the TDI plot will consist of many pixels on the edge of the map which might not be representative of the area of interest. Unless of course the selected number of pixels to skip is small compared to the map dimensions.

In any case, we modified the control from a "dropdown list" to a "combo" control, so now one can enter any value for the number of pixels to skip, so long as the value is between the minimum and maximum values as seen here:


So now one gets a more "random" sampling of pixels as seen here where one can discern the difference in trend for the pixels in the center of this melt inclusion, compared to the pixels in the quartz matrix:

John J. Donovan, Pres. 
(541) 343-3400

"Not Absolutely Certain, Yet Reliable"

John Donovan

  • Administrator
  • Emeritus
  • *****
  • Posts: 3277
  • Other duties as assigned...
    • Probe Software
Re: New TDI Scanning For Beam Sensitive Samples
« Reply #14 on: March 12, 2020, 12:31:47 PM »
As many of you know, in addition to performing a full background, matrix, and interference correction for quantitative x-ray maps, CalcImage also can perform a time dependent (TDI) correction for when mapping beam sensitive samples.  This is done by acquiring "replicate" maps at the on-peak emission positions, which allows CalcImage to correct the on-peak intensities for TDI effects, by extrapolating back to zero time. 

This is very similar to how the TDI correction for point analyses in Probe for EPMA is performed, except that instead of the extrapolating back tens of seconds to zero elapsed time, the TDI correction in CalcImage extrapolates *hours* back to zero time, due to the long acquisition time for x-ray maps!  Yes, I also did not believe this could possibly work, but indeed it does as shown in the last plot in this post above: 

https://probesoftware.com/smf/index.php?topic=912.msg5904#msg5904

The reason I suspect this TDI scanning correction for x-ray maps works, is because for a given stage (or beam) position, the ions only migrate as they heat up from beam exposure, and then once the beam scans past, the ions stop migrating again, until the next replicate TDI scan comes back hours later. And this change in emission intensities over time, is captured nicely by these replicate map scans.

Anyway, as part of this quantitative TDI correction for x-ray maps, the program automatically calculates a "TDI correction percent" for each map pixel for the TDI elements (those elements which are acquired first before any prior beam damage has occurred).  These TDI Correction Percent maps are the relative percent TDI correction that was applied to each pixel, due to the TDI correction during the x-ray map quantification.

Julien Allaz, who has been doing a number of TDI scans on beam sensitive samples for quantitative x-ray mapping, recently wondered if we could display the TDI correction percent images in CalcImage more easily.  At that time, one would need to load each TDI Correction Percent GRD file using the File menu in CalcImage and then (if desired) utilize the Output Currently Displayed Maps to Surfer option.

So after a bit of work, the team at Probe Software has added two new menus to the Project menu in CalcImage. First a new menu in the Export the Project Grid Files for Presentation Output menu shown here:


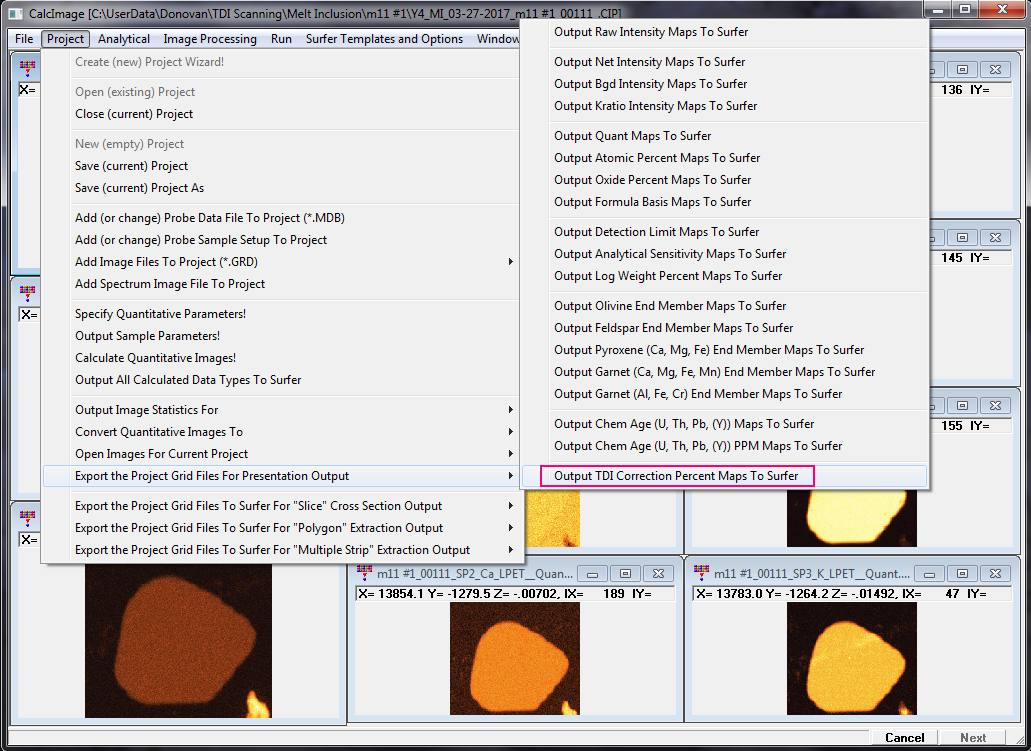
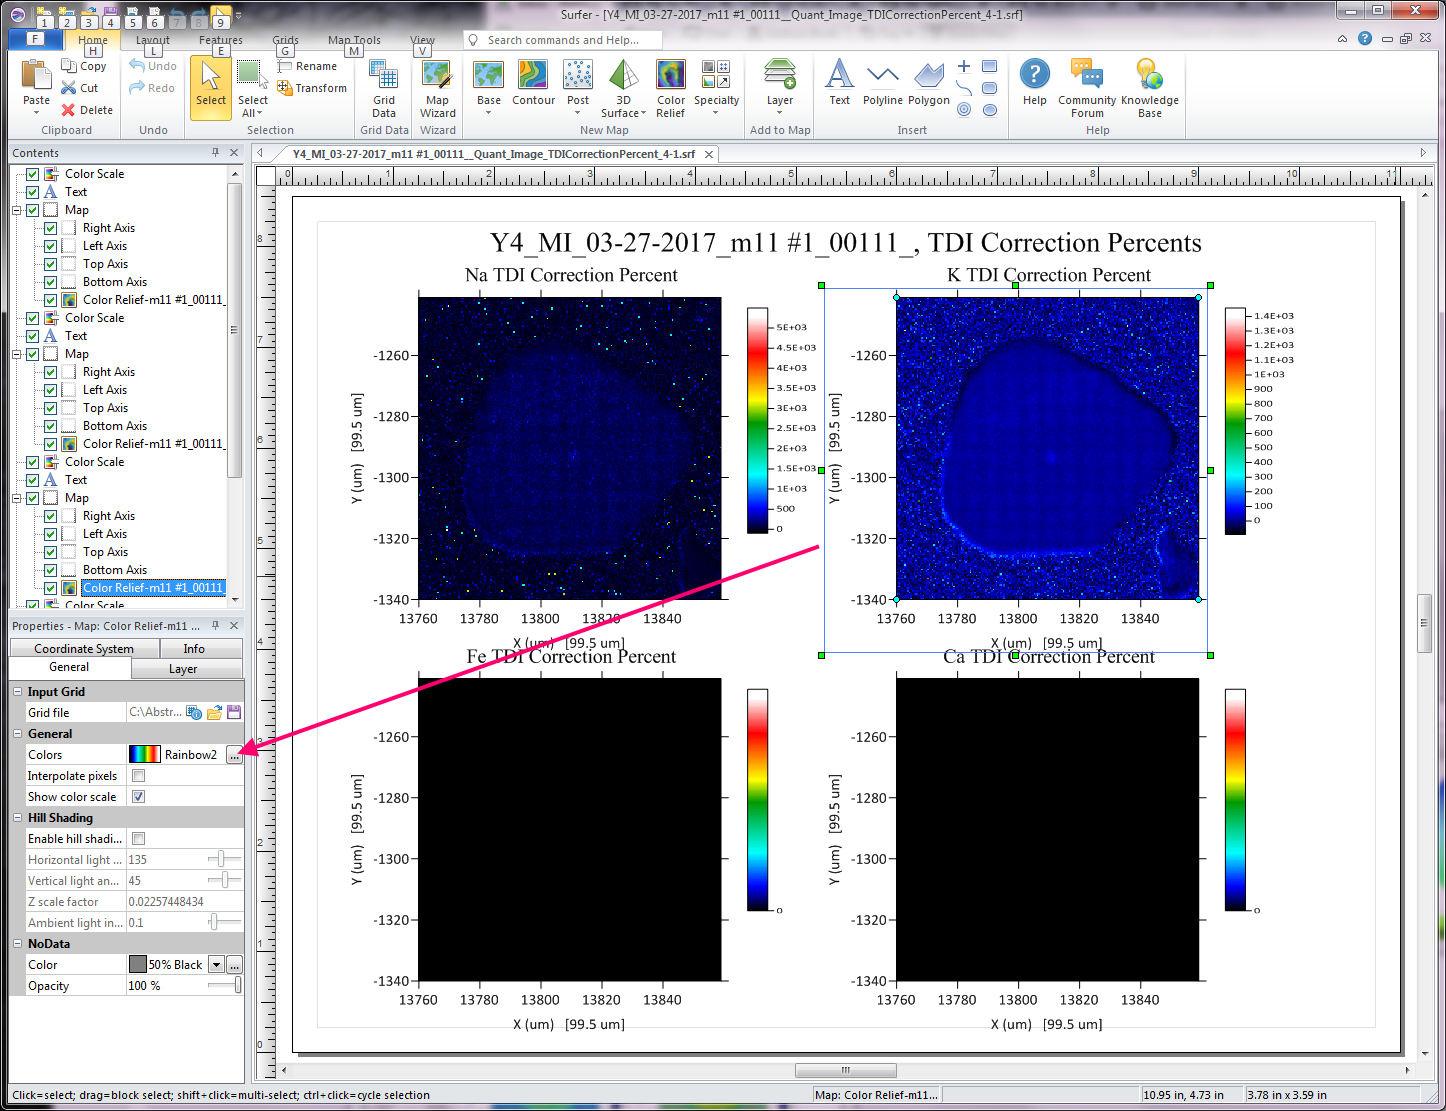
and also a similar menu in the Open Images for Current Project menu.  Here are the calculated TDI correction percent images for a melt inclusion in a quartz matrix using the new Open Images for Current Project menu:


First notice that only TDI corrections for Na, K and Si show any results, and this is because the TDI corrections for Fe and Ca were turned off (because these elements are not subject to ion migration and hence applying the corrections just increases the scatter in the data).  Next notice that the Na and K TDI correction percent images are a bit dark, and that is because although the absolute intensities of the quartz pixels are low, the TDI corrections (in relative percent) can be very high, thus producing a "hot pixel" effect, thus swamping the TDI corrections in the melt inclusion.

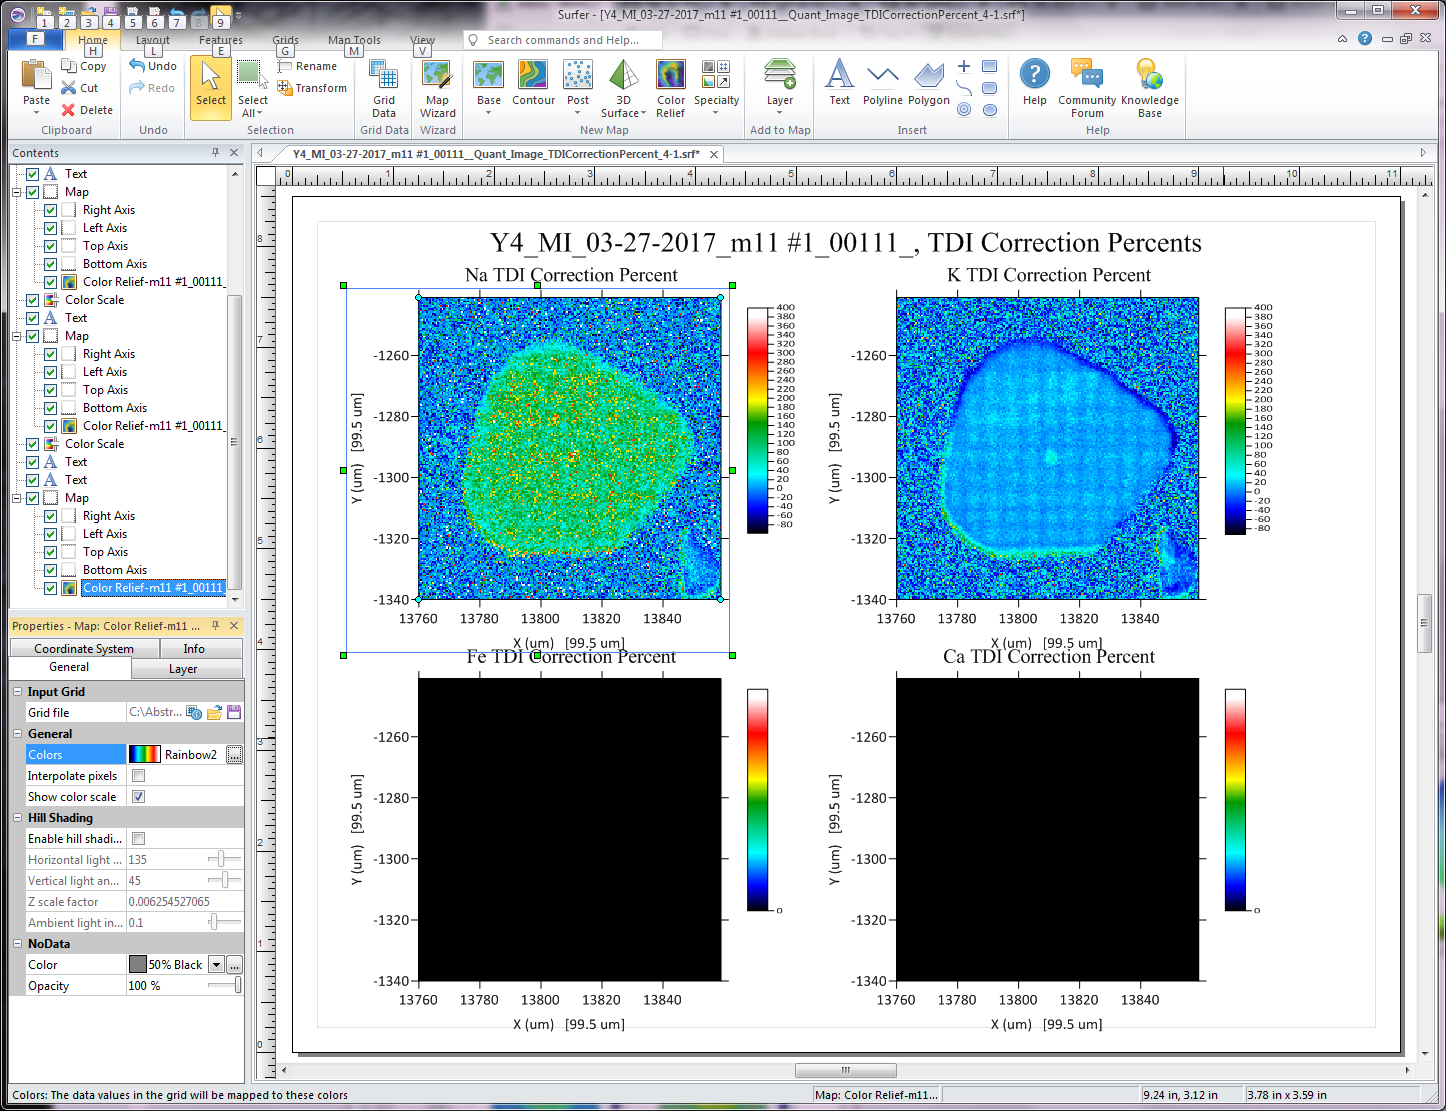
So let's export these TDI correction percent maps to Surfer (or into almost any other image processing software) and make some adjustments there as seen here:


Once we change the maximum value in the "Colors" dialog to a more reasonable number, we get a much better display as seen here:


And just to complete the story, here is the presentation output (which is also easily modified), showing oxide weight percents in this melt inclusion for a few of the elements:


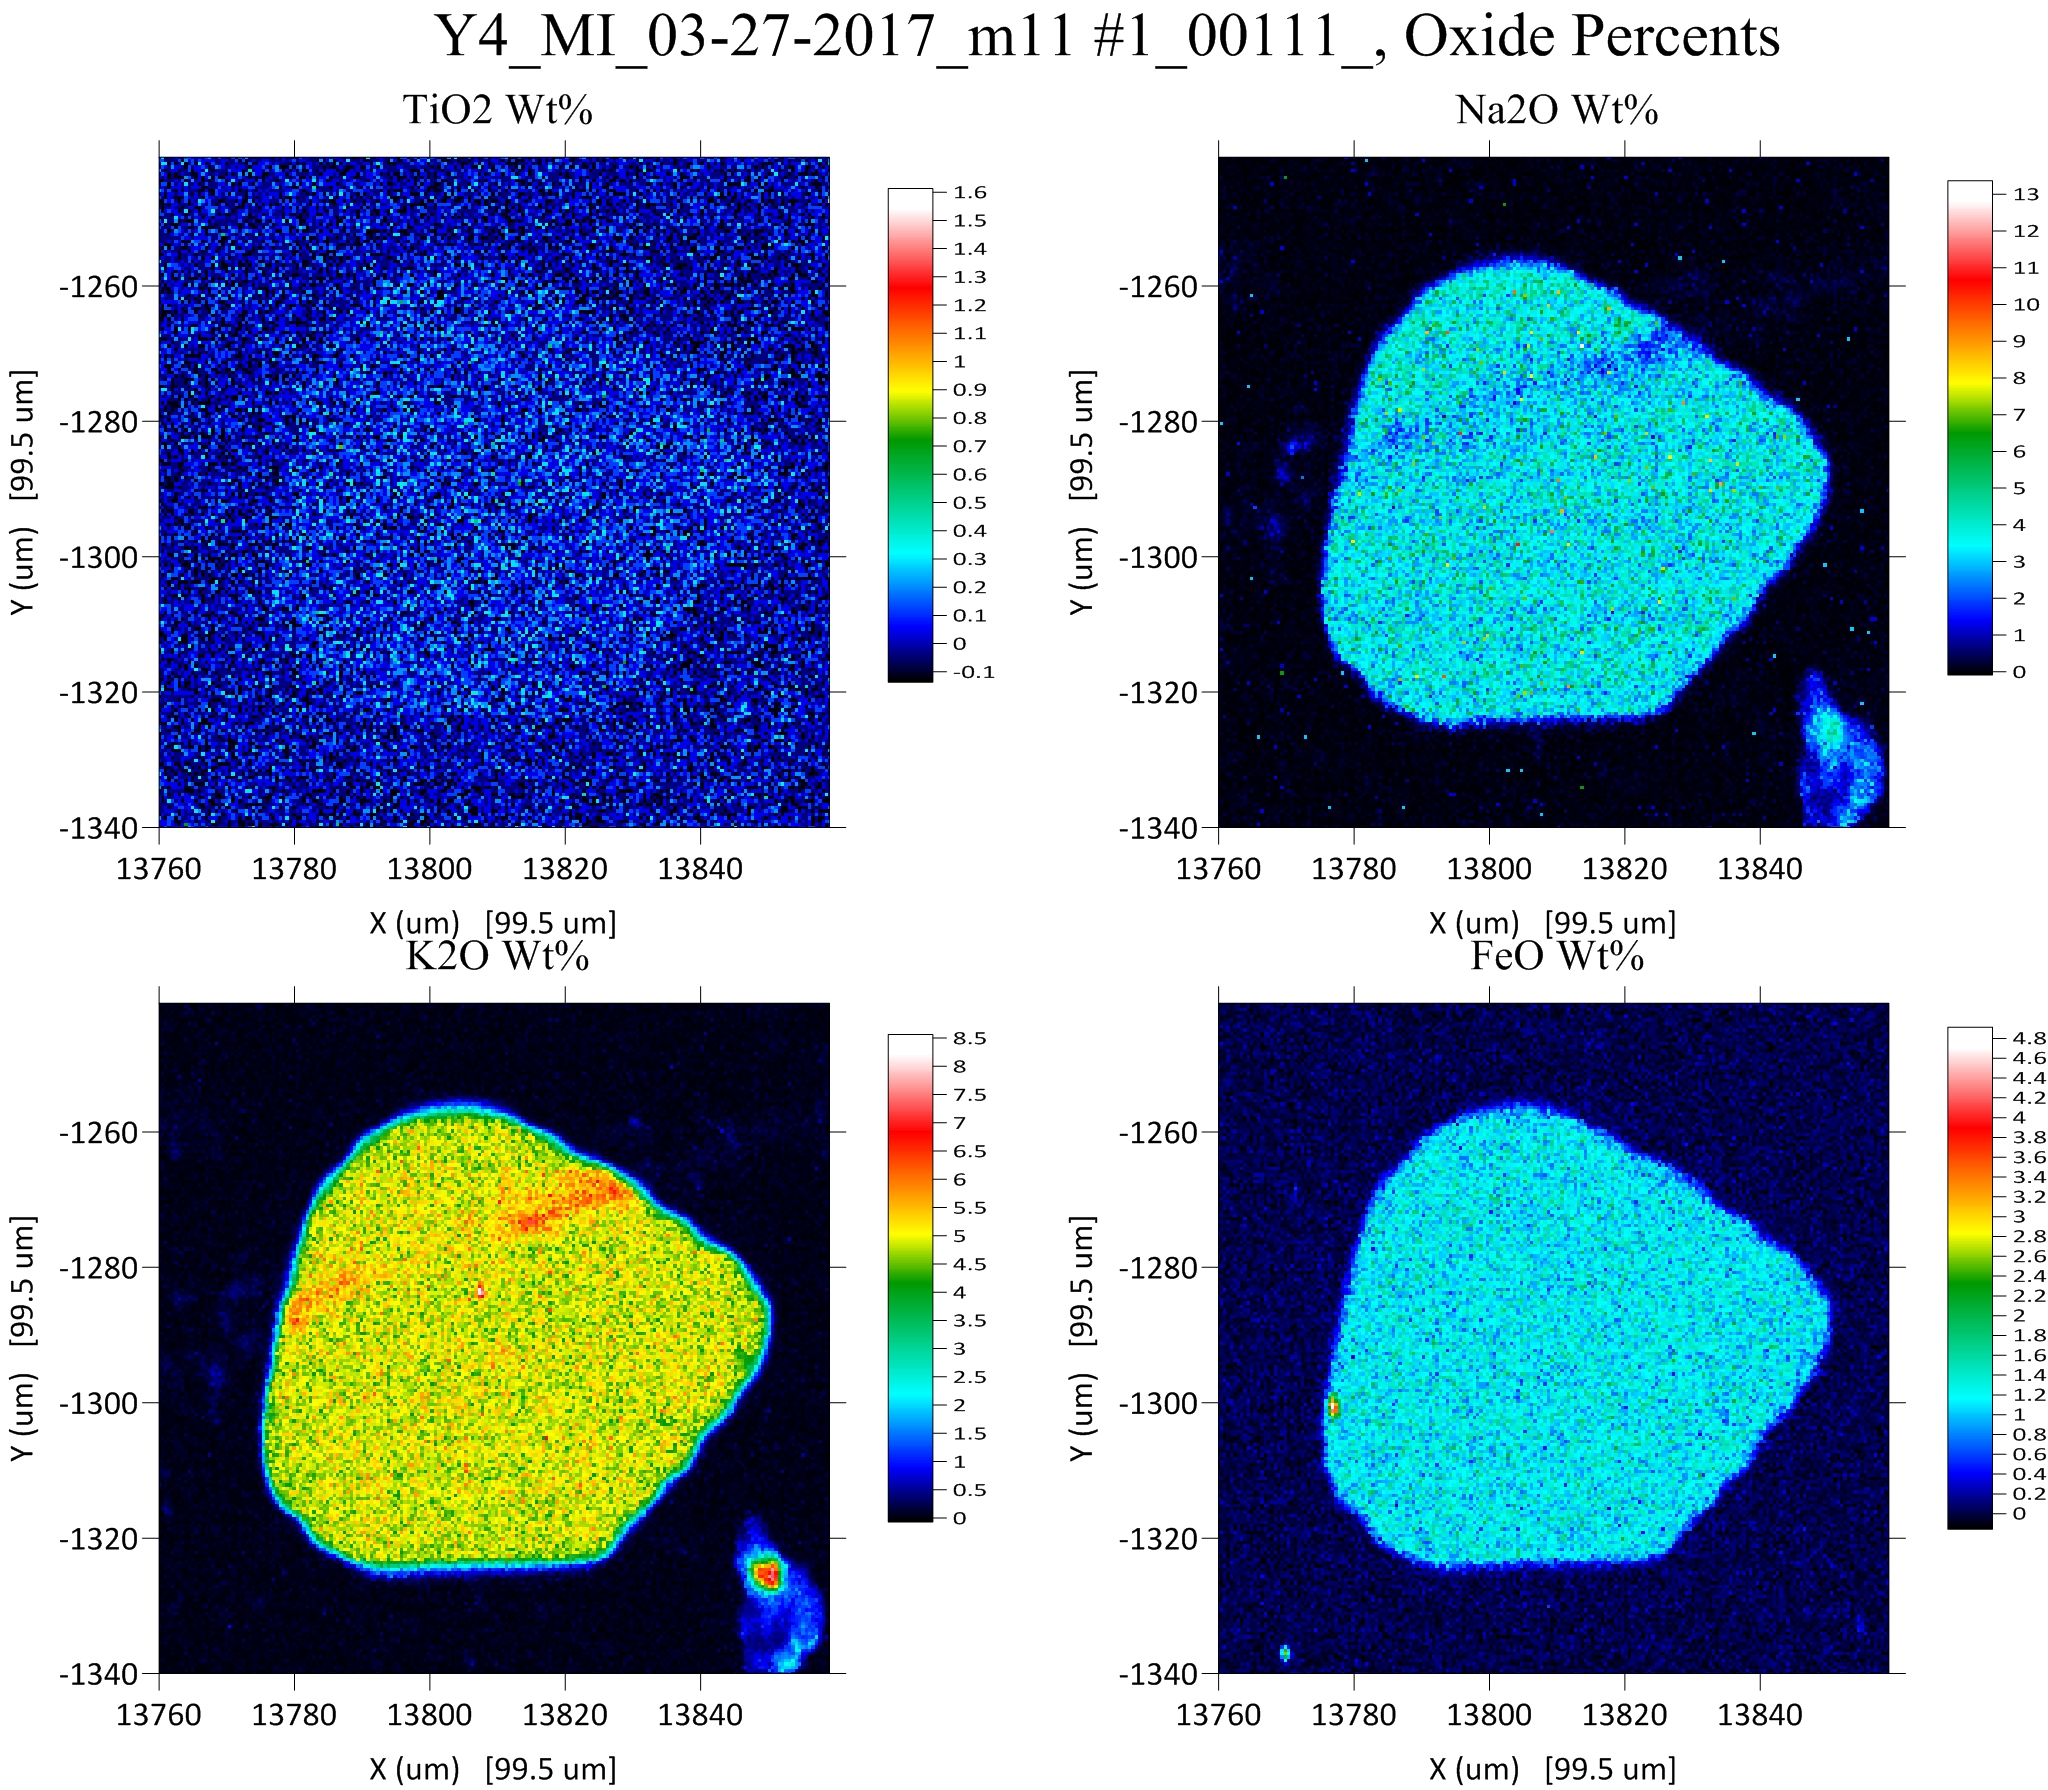
Note how the "gridding" pattern seen in the raw data is almost entirely corrected for by the TDI correction. As for where this "gridding" effect comes from, see the discussion here:

https://probesoftware.com/smf/index.php?topic=144.msg590#msg590

It is an area of active research and I welcome any suggestions or advice!
« Last Edit: March 13, 2020, 02:39:07 PM by John Donovan »
John J. Donovan, Pres. 
(541) 343-3400

"Not Absolutely Certain, Yet Reliable"