Author Topic: Questions about MAN background use  (Read 62604 times)

Mike Spilde

  • Post Doc
  • ***
  • Posts: 18
Questions about MAN background use
« on: July 01, 2013, 12:55:59 PM »
Hi PFE users,

John asked me to post my questions to the new users forum. I want to use the MAN background correction while measuring REE-bearing pegmatite minerals. I've used the off-peak backgrounds in the past on the JEOL, but for the entire suite of REEs and associated elements (32 total elements in the file), it is extremely difficult to get all the background positions correct. The MAN background method seems like it would be just the ticket. I'm not worried about trace levels, just the general level of REE (HREE vs LREE for example). So, I have some questions that I hope you could help with.

1) Has anything been published on this method? 

2) The reference manual says the method is not good for high atomic number samples. Why not? Has anyone tested it on REE analyses? My samples are in the range of Z=30-60. 

3) Paul showed me how to assign MAN fits using my calibration analyses, but as I am setting up the MAN assignments, what do I look for in terms of the fits? I have a number of standards calibrated and there is a good deal of scatter on some elements, so I take some standards out to get less scatter. What is considered a good intercept? I assume that approaching zero is good but a negative is not? How about the Rel% Deviation? I assume low is better but how low? 3 or less? 10 or less?

4) Does one always want to force a straight-line fit?

5) Are the values reassigned with each new file and calibration? If I copy a previous file but use a new calibration, are the values reassigned or are the previous values used?

Any advice would be appreciated.
Thanks, Mike

John Donovan

  • Administrator
  • Emeritus
  • *****
  • Posts: 3268
  • Other duties as assigned...
    • Probe Software
Re: Questions about MAN background use
« Reply #1 on: July 01, 2013, 06:12:07 PM »
Hi Mike,
Thanks.  I think others could benefit from my answers to your excellent questions. Therefore...

Hi PFE users,

John asked me to post my questions to the new users forum. I want to use the MAN background correction while measuring REE-bearing pegmatite minerals. I've used the off-peak backgrounds in the past on the JEOL, but for the entire suite of REEs and associated elements (32 total elements in the file), it is extremely difficult to get all the background positions correct. The MAN background method seems like it would be just the ticket. I'm not worried about trace levels, just the general level of REE (HREE vs LREE for example). So, I have some questions that I hope you could help with.

1) Has anything been published on this method? 

The original paper is here:

http://probesoftware.com/Improved%20MAN%20%28Jour.%20Micros.%20Microa.,%201996%29.pdf

But you should contact Karstem Goemann who presented exactly what you want to do (MAN of REE minerals) at M&M in Nashville.

2) The reference manual says the method is not good for high atomic number samples. Why not? Has anyone tested it on REE analyses? My samples are in the range of Z=30-60. 

Yes, I didn't try to "push the envelope" and limited myself to oxides and silicates but Karsten has used this for REE bearing minerals and Dave Wark also with excellent results on high Z super alloys (also presented at the same M&M).  You might want to get their abstracts at least.

3) Paul showed me how to assign MAN fits using my calibration analyses, but as I am setting up the MAN assignments, what do I look for in terms of the fits? I have a number of standards calibrated and there is a good deal of scatter on some elements, so I take some standards out to get less scatter. What is considered a good intercept? I assume that approaching zero is good but a negative is not? How about the Rel% Deviation? I assume low is better but how low? 3 or less? 10 or less?

Rule of thumb : the lowest measured intensity (at a given average atomic number) is by definition the background. Since the intensities are corrected for continuum absorption the only thing that should be problematic are interferences and/or contamination and both of these issues will produce anomalously high intensities.  So deselect the stds that give higher intensities and click the Update Fit button.

4) Does one always want to force a straight-line fit?

I only use that option if I have three points with two very close together so it gives a weird 2nd order fit.  Or for two point fits obviously.

5) Are the values reassigned with each new file and calibration? If I copy a previous file but use a new calibration, are the values reassigned or are the previous values used?

It depends if you also loaded the standard intensities or not when loading a File Setup. If you don't load the standard (and MAN std) intensities, the assignements will be there, but no data.  The standard intensities must be reacquired.

But if you *do* load the std intensities, you can simply reacquire the most important stds, usually for the major elements.  The backgrounds usually do not change significantly for obvious reasons.
John J. Donovan, Pres. 
(541) 343-3400

"Not Absolutely Certain, Yet Reliable"

Gareth D Hatton

  • Professor
  • ****
  • Posts: 51
Re: Questions about MAN background use
« Reply #2 on: July 02, 2013, 12:37:27 AM »
Although I have not used MAN for REE analysis I have used it for high Z on low Z with no trouble.  This was not trace but around 1% Pt and 1% Pd on Alumina.

John Donovan

  • Administrator
  • Emeritus
  • *****
  • Posts: 3268
  • Other duties as assigned...
    • Probe Software
Re: Questions about MAN background use
« Reply #3 on: July 02, 2013, 08:30:10 AM »
Although I have not used MAN for REE analysis I have used it for high Z on low Z with no trouble.  This was not trace but around 1% Pt and 1% Pd on Alumina.

Hi Gareth,
Yes, this is still a low Z analysis for the unknown, but did you use the MAN also for the Pt and Pd standards? 

A feature I don't use often enough is the fact that you can specify different bgds for the std and unk. For example, you could use the MAN bgd for your Al2O3 samples since the Z range is very limited and use off-peaks for the Pt and Pd stds which would be a pain to acquire a wide range of Z MAN stds for.

Of course the bgd on a trace element std (i.e., pure element) isn't very important from a statistical consideration. So in that sense it don't matter especially, but off-peaks on the Pt and Pt metal stds would be quick and easy. I like quick and easy.   :)
john
John J. Donovan, Pres. 
(541) 343-3400

"Not Absolutely Certain, Yet Reliable"

Philipp Poeml

  • Professor
  • ****
  • Posts: 219
Re: Questions about MAN background use
« Reply #4 on: July 02, 2013, 08:42:24 AM »
Hi John,

does this mean --- and do you think it would make sense --- if I would use the same approach? Like, using offpeak backgrounds for PuO2, UO2, whatever stadards, but then measure on the sample with plenty of REEs and actinides using the MAN backgrounds? That might be very interesting to try.

Using MAN for standards and unknown did not work out.

Cheers
Ph

John Donovan

  • Administrator
  • Emeritus
  • *****
  • Posts: 3268
  • Other duties as assigned...
    • Probe Software
Re: Questions about MAN background use
« Reply #5 on: July 02, 2013, 09:14:19 AM »
Hi Philipp,
Yes, you have a special situation with actinides and all.

And I don't think this feature of using off-peak backgrounds on stds and MAN bgds for unkns would help you much because your unknowns are pretty much like your stds. That is both your stds and unks are very, very high Z!   

For Gareth's situation, his samples are almost pure Al2O3 so very low Z compared to his Pt and Pd stds.  These samples are ideal for this bgd feature.

John J. Donovan, Pres. 
(541) 343-3400

"Not Absolutely Certain, Yet Reliable"

Karsten Goemann

  • Global Moderator
  • Professor
  • *****
  • Posts: 227
Re: Questions about MAN background use
« Reply #6 on: July 04, 2013, 06:38:04 PM »
All, here is the link to the abstract of my M&M2011 presentation that John was referring to:

http://dx.doi.org/10.1017/S143192761100376X

Let me know if you can't access the abstract and I'll send you a copy.

There's not much about MAN in the abstract and it was also only part of the presentation, the larger part was on using multiple backgrounds to analyse Y, REE and others in uranium minerals like uraninite and coffinite.

The MAN data I presented there was for analysing florencite (a beam sensitive & water bearing REE-Al-phosphate) which only has a MAN of around 22. It worked very well for lower Z elements, still reasonably well for LREE, but not so well for HREE, see attached file. The graph shows an average for around 20 florencite measurements which were acquired using off-peak backgrounds, and comparing those results with the results using MAN backgrounds for the same dataset. The red curve is the "original" and the purple one the final "best" curve after including water by difference and using linear MAN fits.

This plot will show problems with both off-peak and MAN backgrounds. The Al deviation is due to limitations with off-peak positioning, potentially something similar for Ce, and La, but these are all major elements in florencite, so the effect is marginal and I did not investigate further.

The HREE are below detection limit, and the absolute values using MAN were around -0.1wt% for Dy and Er, and -0.05wt% for Yb, which is a bit of a concern. Back then I didn't have the time to sort this out for those particular samples. I tried to use conditions providing stable intensities, but the HREE were measured at the end of the program so there still might have been a issue with damage, sub-surface charging... If that's the case it's strange though didn't affect the later elements on the other spectrometers. One obvious thing to try would be to change the measurement order. The grains were too small to defocus further than 10µm.

Another issue is standards, not only secondary standards, but I also only have the Smithsonian orthophosphates for REE calibration at the moment. It is well known that their LREE standards (La to Gd) contain varying amounts of Pb (see http://dx.doi.org/10.6028/jres.107.056), so Pb needs to be individually determined and corrected in the reference composition, as far as that is possible as concentrations can vary within chips. Some of them contain minor amounts of other REE as well. John already said that both interferences and small amounts of the element in question will push the datapoint up in the MAN plots, so it is better to use the lower values, but if the reference composition of a standard is not correct it can go in any direction. I learned a lot about our standards looking at MAN plots (in terms of reference values, purity, contamination) and many of them are not as well characterised or "clean" as I'd like them to be.

I have since then used MAN to analyse monazite with good results, again majors & minors only, no traces! I'll see if I can put a few more details together and post them. Again, one problem is method validation, as I only have monazite "age" standards, none with a well constrained composition.

Cheers, Karsten


John Donovan

  • Administrator
  • Emeritus
  • *****
  • Posts: 3268
  • Other duties as assigned...
    • Probe Software
Re: Questions about MAN background use
« Reply #7 on: September 11, 2013, 12:20:19 PM »
There is a simple method to compare the same intensity data using off-peak, MAN and Nth point background corrections.

First acquire a set of data for your elements of interest on some standards using normal off-peak backgrounds. Because you will also be fitting a MAN calibration curve, one also needs to acquire intensity data on standards that *do not* contain the elements of interest. For silicate elements one might select, in addition to the primary stds, standards such as MgO, SiO2, Al2O3, TiO2 and NiO, etc. Again, using full off-peak backgrounds.

Once the intensity data is acquired one can then perform quant analyses on the standards using the acquired off-peak background corrections.

Next, go to the Analytical menu and check the Use Off-Peak Elements For MAN Fit menu as seen here:


Now fit your MAN backgrounds as usual using the Analytical | Assign MAN Fits menu, but note that the software will automatically utilize off-peak acquired element intensities for the MAN fit by ignoring the off-peak data for the standards and fit only the on-peak intensities!

Next go to the Analytical menu and check the Use MAN Correction For Off-Peak Elements menu. This tells the software to force off-peak measured elements to utilize the MAN calibration curve for the background correction as seen here:


Now you can analyze your standards that were acquired using off-peak backgrounds, but now using the  MAN calibration curve for comparison.

Finally go to the Analytical | Analytical Options dialog and select the Use Nth Point Calculation For Off-Peak Intensities as shown here:


Now uncheck the Analytical menu | Use MAN Correction For Off-Peak Elements menu and now you can analyze your off-peak acquired standards using *only* the off-peak intensities from the first point of every sample.

This way one can acquire and compare the same data set using off-peak, MAN and Nth Point background corrections. A white paper with more details is attached below.  Remember that one needs to be logged in to see attachments!
« Last Edit: September 21, 2013, 11:34:04 PM by John Donovan »
John J. Donovan, Pres. 
(541) 343-3400

"Not Absolutely Certain, Yet Reliable"

John Donovan

  • Administrator
  • Emeritus
  • *****
  • Posts: 3268
  • Other duties as assigned...
    • Probe Software
Re: Questions about MAN background use
« Reply #8 on: December 01, 2013, 12:38:25 PM »
Maybe this would be a good time to examine the method of Mean Atomic Number (MAN) background correction in more detail.

The example I am utilizing is from Paul Carpenter at Washington University (used with permission) and Paul acquired this MAN calibration data set for use in quantitative x-ray mapping with Probe Image and CalcImage as can be seen in the beautiful quant x-ray maps attached below. Note the stoichiometric *and* total quant maps which can be automatically generated and output with CalcImage.

Of course the MAN background correction is good to a few hundred PPM in silicates and oxides so it really is "overkill" for quant x-ray mapping, but it sure does save a lot of time because one doesn't need to acquire any off-peak x-ray maps!

So, what is the basis for the the MAN correction? The details are available in this publication:

http://probesoftware.com/Improved%20MAN%20%28Jour.%20Micros.%20Microa.,%201996%29.pdf

but it suffices to say that it is based on Kramer's Law, where in the absence of the element under investigation, the on-peak x-ray production of the material can be used to calibrate the continuum background. The MAN correction also contains an adjustment for absorption of the continuum of the emission line being investigated and for the matrix in question (both for the MAN calibration standards and the unknowns).  Since the standard compositions are already known, the calculation of mean atomic number (MAN) is easily performed. In the case of unknowns, the mean atomic number of the sample is calculated during the ZAF or phi-rho-z matrix iteration.

So now let us examine the first element measured in these x-ray maps, Na ka as seen here in the Analytical | Assign MAN Fits menu available in both Probe for EPMA and CalcImage:


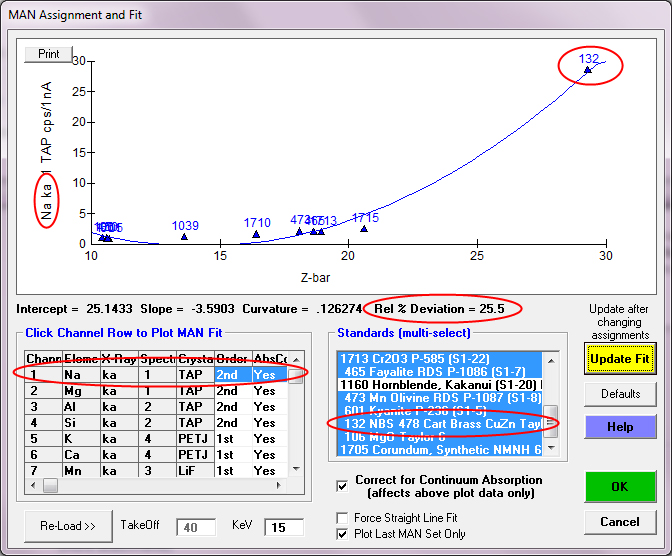
Of course, we can immediately see one problem, and that is that the NBS CuZn alloy is very much an outlier in our Na MAN fit. Why is that? Well it's because of our old friend, the Zn La on Na interference. Now, this interference could be corrected for in PFE- but let's not get carried away! There are plenty of other MAN standards to fit for Na, and besides, we aren't measuring materials with that high an average Z anyway!

So let's unselect that standard from our MAN fit by using a <ctrl> click of the mouse and then we click the Update Fit button to re-plot the fit as seen here.


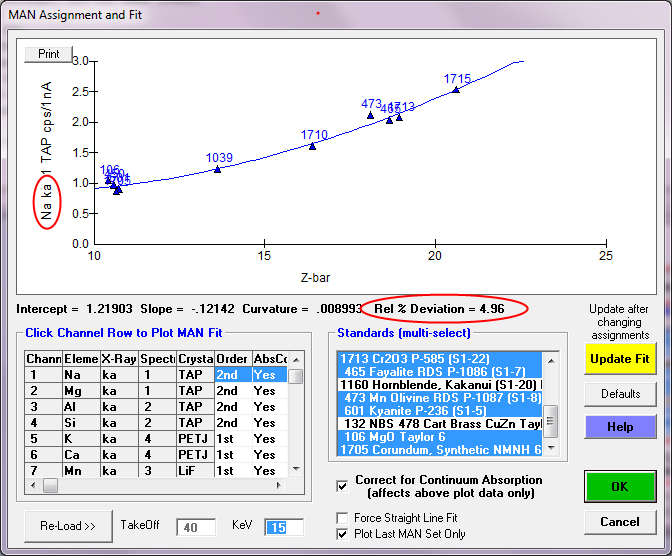
Note the now much more reasonable fit to the on-peak x-ray intensities from our standards, which is loaded by default based on whether the standard contains the element under investigation. Since the standard composition database indicated no Na in the NBS CuZn alloy, the software loaded that standard intensity. But for other standards that actually contain Na, for example, Kakanui Hornblende, the x-ray intensities for that standard material are not loaded for the default MAN fit.

To demonstrate the necessity of the continuum absorption correction, we can unselect the correction for continuum absorption by unchecking the checkbox and the significantly worse fit is quite evident. Why is this? Because every standard composition absorbs continuum radiation (i.e., at the characteristic energy of our elements of interest) in somewhat different degrees, depending on the physics details- that is why we have absorption edges in our EDS continuum spectra!


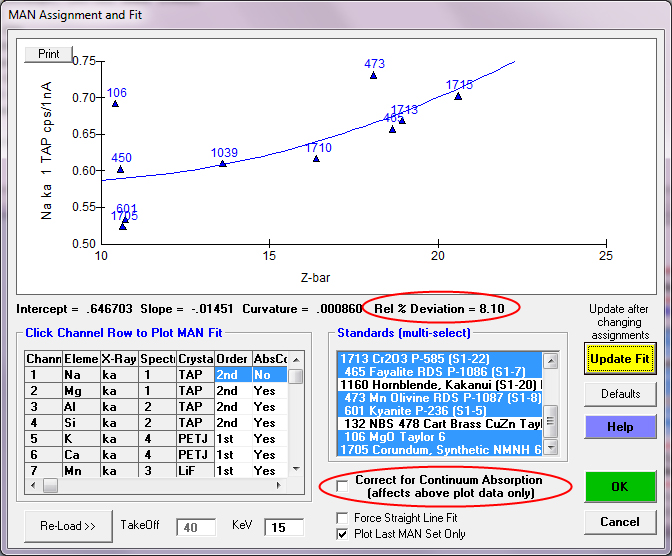
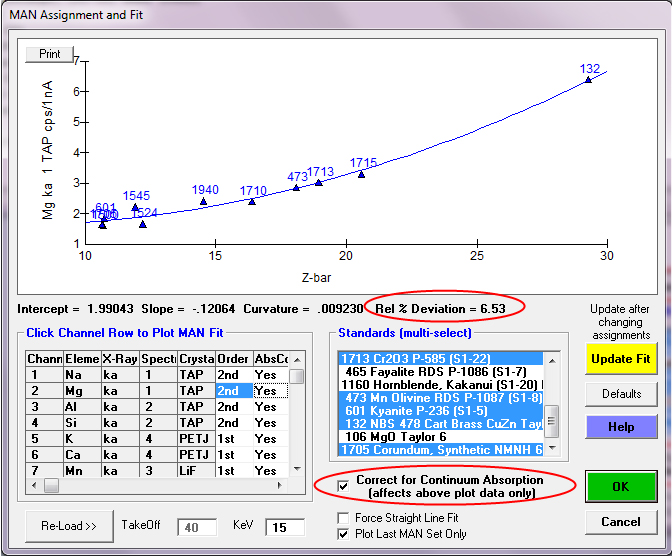
So clearly the correction for continuum absorption is necessary, as seen also in this plot of Mg ka in standards  that do *not* contain Mg:


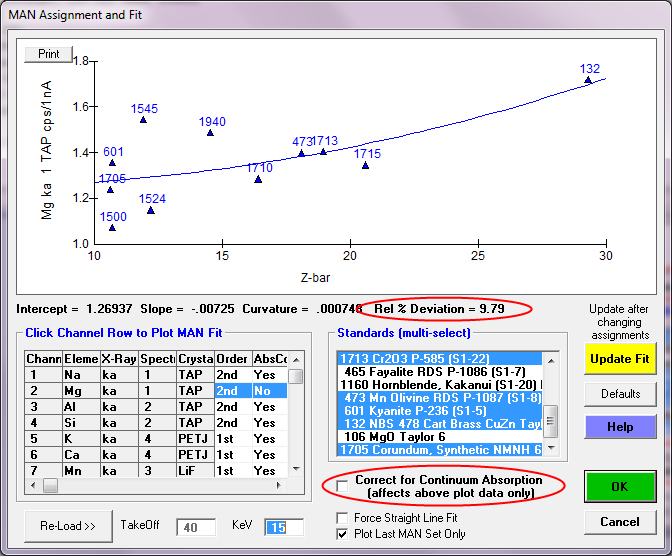
By including the correction for continuum absorption for Mg ka we are back in business as seen here:


Don't worry, the program defaults all these options automatically!   8)

So, let's move on to a different situation as seen here for Mn ka:


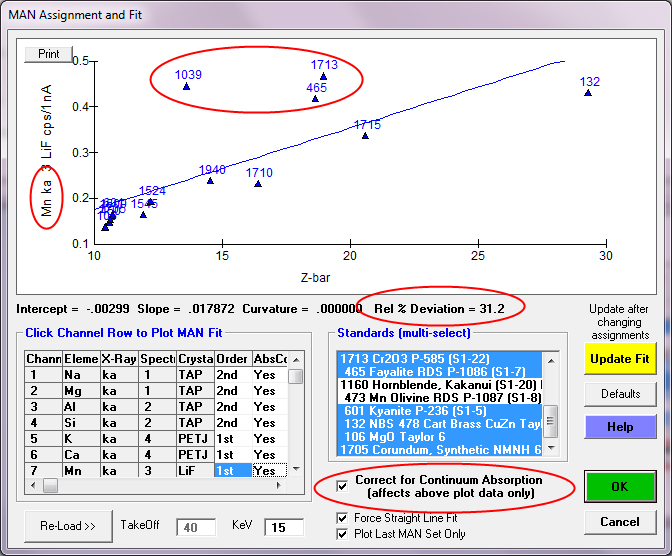
Here, again, we see some outliers in our MAN fit, but these are *not* from spectral interferences from other elements, as was the case for Zn La on Na. These are standards which contain small amounts of Mn that have *not* been specified in the standard composition database. Paul puts it himself this way:

"1039 is our wollastonite standard that contains a low concentration of Mn but has not been characterized in the standard analysis yet. 1713 is Elba hematite that is also being adjusted, and the synthetic fayalite 465 also contains very low Mn. On a wavelength scan this level of Mn is not apparent."

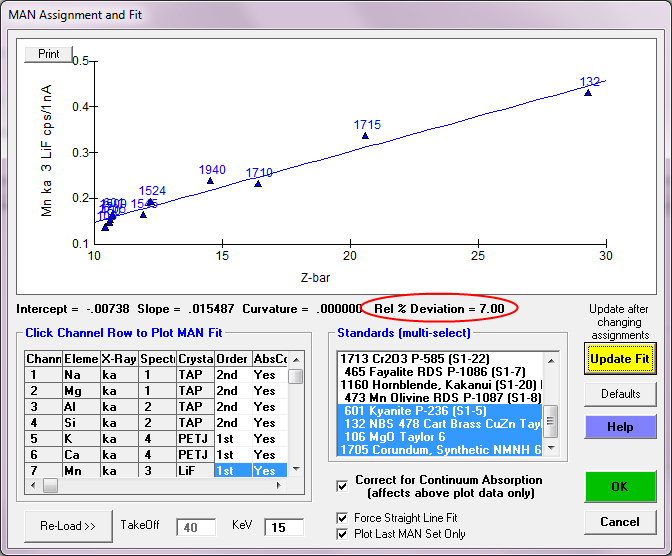
By simply unselecting these standards which contain trace amounts of Mn, we can get a more accurate model of the background for our Mn measurements. Remember: background is by definition the lowest intensity one can measure!  Interferences and "contamination" will all cause elevated outliers to the fit.  Of course there are some subtle continuum artifacts as documented here:

http://probesoftware.com/Ti%20in%20Quartz,%20Am.%20Min.%20Donovan,%202011.pdf

but those are in the sub 100 PPM level! So not exactly significant for quant-xray mapping even when measuring off-peak images!

So after removing those standards from our fit which contain "undocumented" Mn, we obtain the following fit:


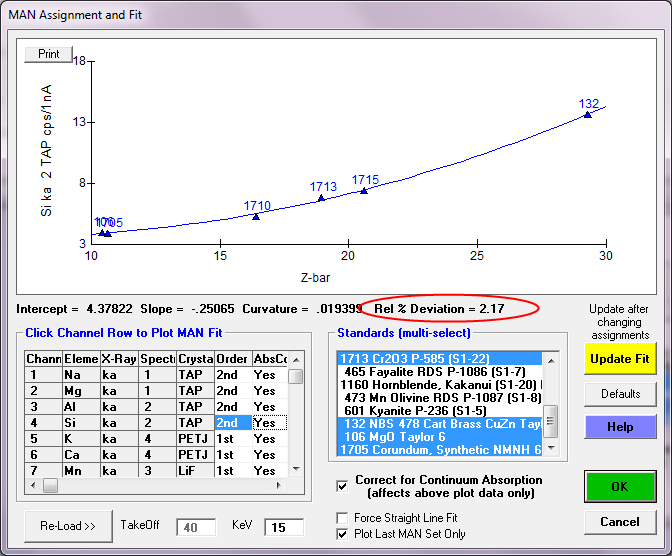
For an element such as Si or Al we obtain beautiful fits using the default MAN assignments made automatically by the program as seen here:


Now check out the gorgeous quant x-ray maps Paul acquired which are automatically corrected for background, matrix and spectral interferences in the attachments below!

It should also be mentioned that at zero concentration levels, using MAN background acquisition improves measurement precision by roughly the Sqr(2) and at the same time cuts the necessary acquisition time by 50%.

See the attachments posted here for details:

http://probesoftware.com/smf/index.php?topic=29.msg237#msg237

« Last Edit: January 05, 2014, 09:29:37 PM by John Donovan »
John J. Donovan, Pres. 
(541) 343-3400

"Not Absolutely Certain, Yet Reliable"

Probeman

  • Emeritus
  • *****
  • Posts: 2831
  • Never sleeps...
    • John Donovan
Re: Questions about MAN background use
« Reply #9 on: December 18, 2013, 01:20:33 PM »
There is a post on using the MAN correction in conjunction with the blank correction in Probe for EPMA on trace element characterization (for simple matrices such as SiO2, TiO2, ZrSiO4), where a suitable zero or non-zero blank material is available here:

http://probesoftware.com/smf/index.php?topic=29.msg237#msg237

The idea is is that one can obtain excellent precision with the MAN background correction because it is the average of multiple standard points, for example, 5 measurements at 30 seconds each for each standard. If one is utilizing 3 or 4 or more standards per MAN fit (element), then the precision is excellent, much better in fact than counting off-peak for the same amount of time.

To illustrate this see the graph below which compares MAN to off-peak to Nth point off-peaks (where the off-peak is utilized only on the first point and re-used for the subsequent points) using the same data set for all calculations as described above:


The Cr off-peak data shows more variance due to the fact that we are subtracting two measurements from each other, while the MAN correction is essentially a constant at a given average atomic number which should not change much for a say SiO2 matrix.  Of course the beauty of the MAN correction (unlike the Nth point method) is that it *can* account for changes in the matrix (and therefore background intensity) automatically without measuring the off-peaks! Here's another example:


The full report can be found attached to this post:

http://probesoftware.com/smf/index.php?topic=4.msg189#msg189
« Last Edit: December 18, 2013, 01:27:52 PM by Probeman »
The only stupid question is the one not asked!

Probeman

  • Emeritus
  • *****
  • Posts: 2831
  • Never sleeps...
    • John Donovan
Re: Questions about MAN background use
« Reply #10 on: December 18, 2013, 03:01:58 PM »
I'm running some quantitative x-ray maps with a student on some melt inclusions to see if we can detect any variation in the glass chemistry and in setting up the standards I decided to acquire all ten elements using MAN backgrounds. Here is a sample of a standard and the amazing accuracy of the MAN correction (no off-peak measurements) even for trace elements:

St  305 Set   1 Labradorite (Lake Co.)
TakeOff = 40.0  KiloVolt = 15.0  Beam Current = 30.0  Beam Size =    5
(Magnification (analytical) =  20000),        Beam Mode = Analog  Spot
(Magnification (default) =     2524, Magnification (imaging) =    736)
Image Shift (X,Y):                                        50.00,   .00

Specimen from HR Wenk, UC Berkeley, Geology
See Wenk and Kroll, Bull. Mineral. (1984), 107, 467-487
Number of Data Lines:   5             Number of 'Good' Data Lines:   5
First/Last Date-Time: 12/17/2013 04:08:12 PM to 12/17/2013 04:17:53 PM
WARNING- Using Time Dependent Intensity (TDI) Element Correction

Average Total Oxygen:         .000     Average Total Weight%:  100.109
Average Calculated Oxygen:    .000     Average Atomic Number:   11.560
Average Excess Oxygen:        .000     Average Atomic Weight:   21.022
Oxygen Equiv. from Halogen:   .010  Halogen Corrected Oxygen:    -.010
Average ZAF Iteration:        4.00     Average Quant Iterate:     4.00

St  305 Set   1 Labradorite (Lake Co.), Results in Elemental Weight Percents
 
ELEM:       Na      Si       K      Al      Mg      Fe      Ca      Mn      Ti       F       O       H
TYPE:     ANAL    ANAL    ANAL    ANAL    ANAL    ANAL    ANAL    ANAL    ANAL    ANAL    SPEC    SPEC
BGDS:      MAN     MAN     MAN     MAN     MAN     MAN     MAN     MAN     MAN     MAN
TIME:    30.00   30.00   30.00   30.00   30.00   30.00   30.00   30.00   30.00   30.00
BEAM:    29.93   29.93   29.93   29.93   29.93   29.93   29.93   29.93   29.93   29.93

ELEM:       Na      Si       K      Al      Mg      Fe      Ca      Mn      Ti       F       O       H      SUM 
    21   2.907  25.278    .101  16.170    .089    .309   9.575    .002    .009   -.014  46.823    .000    101.248
    22   2.852  23.590    .109  16.328    .088    .291   9.500   -.001    .024    .047  46.823    .000     99.650
    23   2.831  23.548    .105  16.421    .087    .359   9.596    .002    .005    .040  46.823    .000     99.817
    24   2.807  23.594    .108  16.406    .087    .359   9.588    .001    .001    .014  46.823    .000     99.789
    25   2.809  23.884    .097  16.474    .085    .284   9.531    .000    .022    .034  46.823    .000    100.043

AVER:    2.841  23.979    .104  16.360    .087    .320   9.558    .001    .012    .024  46.823    .000    100.109
SDEV:     .041    .738    .005    .118    .001    .036    .041    .001    .010    .025    .000    .000       .652
SERR:     .018    .330    .002    .053    .001    .016    .018    .001    .005    .011    .000    .000
%RSD:     1.44    3.08    4.95     .72    1.40   11.39     .43  181.78   83.39  101.80     .00     .00

PUBL:    2.841  23.957    .100  16.359    .084    .319   9.577    .000    n.a.    n.a.  46.823    n.a.    100.060
%VAR:    (.01)     .09    4.03   (.00)    3.72    .42   -.20     .00     ---     ---     .00     ---
DIFF:    (.00)    .022    .004   (.00)    .003    .001   -.019    .000     ---     ---    .000     ---
STDS:      305     358     374     305      12     395     358      25      22     835       0       0     

STKF:    .0155   .2093   .1132   .1275   .4736   .6779   .1693   .7341   .5547   .1715   .0000   .0000 
STCT:    45.98   65.79  225.18  261.40 2197.75  139.51  107.68 1966.75   56.01   27.06     .00     .00 

UNKF:    .0155   .1841   .0009   .1275   .0006   .0027   .0871   .0000   .0001   .0001   .0000   .0000
UNCT:    45.98   57.90    1.86  261.40    2.79     .55   55.42     .01     .01     .01     .00     .00   
UNBG:      .94     .07     .90     .85    1.67     .22     .46    5.03     .06     .06     .00     .00   

ZCOR:   1.8317  1.3023  1.1141  1.2828  1.4496  1.1948  1.0967  1.2151  1.2005  4.1769   .0000   .0000 
KRAW:   1.0000   .8799   .0083  1.0000   .0013   .0040   .5147   .0000   .0002   .0003   .0000   .0000   
PKBG:    50.09  786.71    3.06  307.94    2.67    3.49  121.95    1.00    1.18    1.16     .00     .00   
INT%:     ----    ----    ----    ----    ----     .00    ----    ----    ----     .00    ----    ---- 


I'd call the accuracy (%VAR line) of the K, Mg and Fe results "spurious accuracy" if I didn't see this all the time!  ;)
« Last Edit: December 18, 2013, 03:20:18 PM by Probeman »
The only stupid question is the one not asked!

srmulcahy

  • Student
  • *
  • Posts: 2
    • Research Website
Re: Questions about MAN background use
« Reply #11 on: December 20, 2013, 11:16:35 AM »
My question pertains to overall uncertainty estimation on the MAN method.  There is the uncertainty that comes from the variance in the on peak measurement.  But there should also be a component of uncertainty in the estimation of background intensity from the Assigned MAN fits.

I've attached an example from an assigned MAN fit of Ca Ka on PET for some feldspars I'm running this week.  I've applied a 2nd order polynomial fit to the data (I'm using R for this example, but the results are the same as PFE) and the dashed lines are the 1-sigma confidence intervals of that fit.  The estimated slope is 1.044 +/- 0.334 and the intercept is 3.508 +/- 2.802 (standard errors for uncertainty).


When you use this to estimate the Ca Ka background intensity for Lake County Plagioclase with Zbar of 11.5885 you get 17.37 +/- 0.42 cps/30nA, which is a 2.5% 1-sigma uncertainty. Is this propagated through to the final estimate of uncertainty in PFE?  How does that compare to magnitude of the uncertainty in the background intensity from off peak measurements?
« Last Edit: December 20, 2013, 11:20:28 AM by srmulcahy »
Sean R. Mulcahy
mulcahy@berkeley.edu
UC Berkeley, Cameca SX-51

John Donovan

  • Administrator
  • Emeritus
  • *****
  • Posts: 3268
  • Other duties as assigned...
    • Probe Software
Re: Questions about MAN background use
« Reply #12 on: December 20, 2013, 11:41:44 AM »
Hi Sean,
This is a good question, but a little difficult to answer.

Yes, there is an uncertainty about the MAN fit, but that plot is a function of the average atomic number of the MAN fit, not the concentration of the element.

For example, in the following MAN plot, we can see that the one sigma % deviation for K ka is around 2 %, but in our unknown material, the calculation of the average atomic number is essentially a constant- if the material is even roughly homogeneous.


This is why there is such an improvement in precision when using the MAN correction for trace elements as described here:

http://probesoftware.com/smf/index.php?topic=29.msg237#msg237

Now maybe we can just assume that the precision is constant for a given average atomic number (a not unreasonable simplification), so using the previous labradorite example we obtained 0.104 wt% K:

ELEM:       Na      Si       K      Al      Mg      Fe      Ca      Mn      Ti       F       O       H      SUM
    21   2.907  25.278    .101  16.170    .089    .309   9.575    .002    .009   -.014  46.823    .000    101.248
    22   2.852  23.590    .109  16.328    .088    .291   9.500   -.001    .024    .047  46.823    .000     99.650
    23   2.831  23.548    .105  16.421    .087    .359   9.596    .002    .005    .040  46.823    .000     99.817
    24   2.807  23.594    .108  16.406    .087    .359   9.588    .001    .001    .014  46.823    .000     99.789
    25   2.809  23.884    .097  16.474    .085    .284   9.531    .000    .022    .034  46.823    .000    100.043

AVER:    2.841  23.979    .104  16.360    .087    .320   9.558    .001    .012    .024  46.823    .000    100.109
SDEV:     .041    .738    .005    .118    .001    .036    .041    .001    .010    .025    .000    .000       .652
SERR:     .018    .330    .002    .053    .001    .016    .018    .001    .005    .011    .000    .000
%RSD:     1.44    3.08    4.95     .72    1.40   11.39     .43  181.78   83.39  101.80     .00     .00


So maybe we can just assume that the 2% average variance on the MAN fit applies to the "concentration" of the background as well?  So since the background count rate from MAN is roughly 0.9 cps/nA and .1 wt% corresponds to roughly 1.8 cps/nA then the 2% variance of the MAN applies to background of the .1 wt.% or 0.001 wt.% or 10 PPM.

So if we add that to the 0.005 wt.% or 50 PPM (4.95% variance) we already obtained from the measurement, we obtain a total variance of roughly 0.006 wt.% or 60 PPM.

It makes sense because if we improve the precision of the MAN fit, the additional variance approaches zero. How does that sound?

ELEM:       Na      Si       K      Al      Mg      Fe      Ca      Mn      Ti       F       O       H      SUM
STKF:    .0155   .2093   .1132   .1275   .4736   .6779   .1693   .7341   .5547   .1715   .0000   .0000
STCT:    45.98   65.79  225.18  261.40 2197.75  139.51  107.68 1966.75   56.01   27.06     .00     .00 

UNKF:    .0155   .1841   .0009   .1275   .0006   .0027   .0871   .0000   .0001   .0001   .0000   .0000
UNCT:    45.98   57.90    1.86  261.40    2.79     .55   55.42     .01     .01     .01     .00     .00
UNBG:      .94     .07     .90     .85    1.67     .22     .46    5.03     .06     .06     .00     .00


Edit: Actually, in thinking about this some more, the precision of the fit mostly depends on the accuracy of the continuum absorption correction!  Note the change in fit variance with and without the continuum absorption correction checkbox checked in the Assign MAN Fits dialog above.
« Last Edit: December 20, 2013, 05:40:38 PM by John Donovan »
John J. Donovan, Pres. 
(541) 343-3400

"Not Absolutely Certain, Yet Reliable"

Malcolm Roberts

  • Professor
  • ****
  • Posts: 134
Re: Questions about MAN background use
« Reply #13 on: February 09, 2014, 06:27:38 PM »
Hi John
I've just been listening to Karsten and Paul telling us about the wonders of MAN background usage and came back to Perth fired up and reach for the manual (Users guide and reference) which doesn't give any instruction on how to  set it up rather a simple flavour of what might be done. So I'm sitting here scratching my head with the spectre of long mapping sessions with off peak background acquisition as I cannot get  easily to the crux of what needs to be done. Having waded through a morass of questions and answers on the discussion forum, one question remains unasked and unanswered. That is quite simply, how do you do it. This may need a flow chart.
Specifically, do you need to model all backgrounds for all elements of interest on all specs and all crystals or is it sufficient to chose a position to get counts as a function of z per crystal per spec at a specific I and KV?
Please can I have an stepwise idiot's guide.
Cheers,
Malc.
« Last Edit: February 09, 2014, 06:35:11 PM by John Donovan »

John Donovan

  • Administrator
  • Emeritus
  • *****
  • Posts: 3268
  • Other duties as assigned...
    • Probe Software
Re: Questions about MAN background use
« Reply #14 on: February 09, 2014, 06:35:17 PM »
No problem, you already have it.  Click the Help | Getting Started Manual menu and scroll down to the Assign MAN Background Calibrations chapter around page 153. It will take you through the process mouse click by mouse click.  Once you see how easily it is done, you will be both surprised and pleased.
john
John J. Donovan, Pres. 
(541) 343-3400

"Not Absolutely Certain, Yet Reliable"