Author Topic: Time Dependent Intensity (TDI) Corrections  (Read 26960 times)

John Donovan

  • Administrator
  • Emeritus
  • *****
  • Posts: 3268
  • Other duties as assigned...
    • Probe Software
Time Dependent Intensity (TDI) Corrections
« on: July 05, 2013, 09:34:51 AM »
A recent modification in v. 10.0.4 of PFE allows the user to review the TDI intensity data for *all* samples, which have TDI data acquired, from the Run | Display Time Dependent (TDI) and Alternating (on/off) Intensities menu.

The change now allows the user to see intensity data for TDI channels even if those data points have *not* been assigned the TDI correction, and in addition, the program now adds the string "(TDI off) to those data points to indicate that they are not using the TDI correction, though TDI data was acquired and is available for assignment as seen here:

« Last Edit: February 17, 2014, 10:17:57 PM by John Donovan »
John J. Donovan, Pres. 
(541) 343-3400

"Not Absolutely Certain, Yet Reliable"

John Donovan

  • Administrator
  • Emeritus
  • *****
  • Posts: 3268
  • Other duties as assigned...
    • Probe Software
Time Dependent Intensity (TDI) Corrections
« Reply #1 on: October 01, 2013, 04:16:59 PM »
The Time Dependent Intensity (TDI) correction for changes in x-ray intensity as a function of acquisition time is well known though not completely understood. The physics of ion migration/volatilization as a function of thermal conductivity, ion mobility and electron dose is complex and very likely convolves together several different physical processes with different time scales.

But for the purposes of correcting for this artifact since the sample is what it is, we are left with reducing beam current, increasing beam diameter, decreasing beam exposure (acquisition) time, cooling the sample cryogenically or some combination of these procedures along with a software correction for these effects which, depending on the element, can result in decreases or increases in x-ray intensity over time.

A typical hydrous glass with a normal (log-linear) TDI correction for Na, Si, Al (and Ca and Ti) is shown here:

ELEM:       Na      Si       K      Al      Mg      Ca      Ti      Mn      Fe       P      Cr       O       H
TYPE:     ANAL    ANAL    ANAL    ANAL    ANAL    ANAL    ANAL    ANAL    ANAL    ANAL    ANAL    CALC    SPEC
BGDS:      MAN     MAN     LIN     MAN     MAN     MAN     LIN     LIN     MAN     EXP     LIN
TIME:    80.00   30.00   40.00   40.00   60.00   80.00   20.00   20.00   60.00   60.00   30.00
BEAM:    20.08   20.08   20.08   20.08   20.08   20.08   20.08   20.08   20.08   20.08   20.08

ELEM:       Na      Si       K      Al      Mg      Ca      Ti      Mn      Fe       P      Cr       O       H   SUM 
   235    .315  26.882    .449   4.251   5.416   4.877    .925    .343  11.099    .199    .055  44.303    .000  99.113
   236    .487  26.014    .526   4.256   1.367   5.613    .932    .344  16.725    .194    .027  42.621    .000  99.107
   237    .396  26.547    .455   4.244   4.251   5.551    .907    .344  12.211    .192    .037  43.735    .000  98.870
   238    .359  26.017    .452   4.177   2.586   5.918    .892    .359  14.556    .195    .033  42.777    .000  98.320

AVER:     .389  26.365    .471   4.232   3.405   5.490    .914    .348  13.648    .195    .038  43.359    .000  98.852
SDEV:     .073    .426    .037    .037   1.787    .439    .018    .008   2.507    .003    .012    .799    .000    .373
SERR:     .037    .213    .018    .018    .894    .220    .009    .004   1.254    .001    .006    .400    .000
%RSD:    18.77    1.62    7.83     .87   52.49    8.00    2.01    2.18   18.37    1.49   31.81    1.84     .00

TDI%:   27.702   -.037    ----   -.154    ----  -1.026    .563    ----    ----    ----    ----    ----    ----
DEV%:     10.3      .6    ----     1.1    ----     2.9     8.2    ----    ----    ----    ----    ----    ----
TDIF:   LINEAR  LINEAR    ----  LINEAR    ----  LINEAR  LINEAR    ----    ----    ----    ----    ----    ----
TDIT:    97.00   48.75    ----   58.00    ----   98.75   37.00    ----    ----    ----    ----    ----    ----
TDII:     72.0  10400.    ----   1897.    ----    169.    98.3    ----    ----    ----    ----    ----    ----


As we can see, the TDI % log-linear correction above highlighted in red, is approximately 28% which seems reasonable until one examines the actual extrapolation to zero time, and then a problem is obvious:


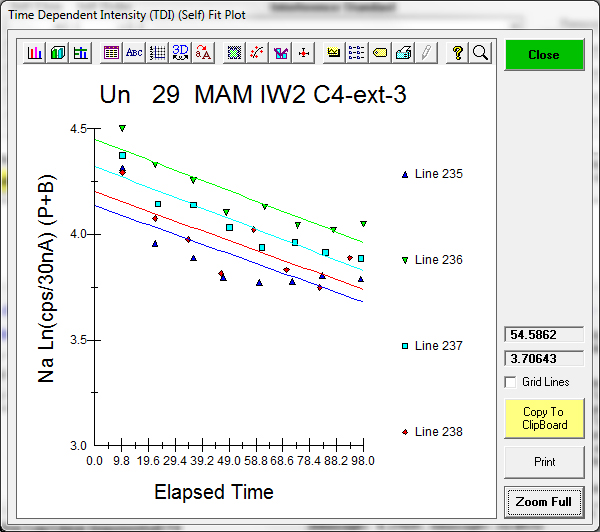
Clearly the intensity change over time is more than a simple exponential.

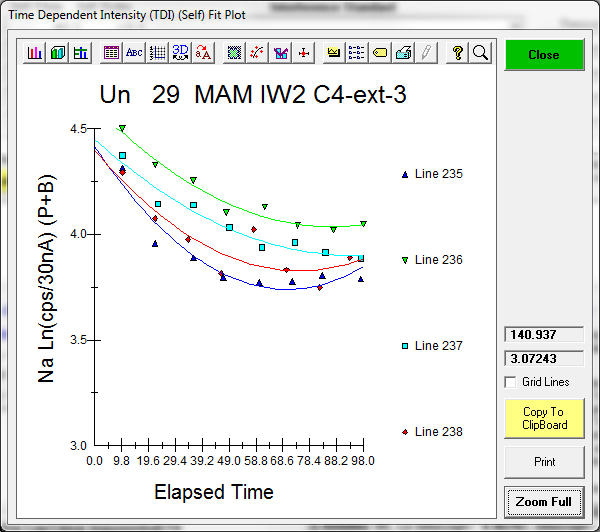
However, by fitting the log intensity to a quadratic and extrapolating again, we obtain the following results as shown below:

ELEM:       Na      Si       K      Al      Mg      Ca      Ti      Mn      Fe       P      Cr       O       H
TYPE:     ANAL    ANAL    ANAL    ANAL    ANAL    ANAL    ANAL    ANAL    ANAL    ANAL    ANAL    CALC    SPEC
BGDS:      MAN     MAN     LIN     MAN     MAN     MAN     LIN     LIN     MAN     EXP     LIN
TIME:    80.00   30.00   40.00   40.00   60.00   80.00   20.00   20.00   60.00   60.00   30.00
BEAM:    20.08   20.08   20.08   20.08   20.08   20.08   20.08   20.08   20.08   20.08   20.08

ELEM:       Na      Si       K      Al      Mg      Ca      Ti      Mn      Fe       P      Cr       O       H   SUM 
   235    .436  26.890    .449   4.253   5.421   4.876    .925    .343  11.099    .199    .055  44.359    .000  99.306
   236    .584  26.021    .526   4.258   1.368   5.613    .932    .344  16.725    .194    .027  42.665    .000  99.257
   237    .461  26.551    .455   4.245   4.253   5.551    .907    .344  12.211    .192    .037  43.766    .000  98.973
   238    .450  26.023    .452   4.179   2.588   5.918    .892    .359  14.556    .195    .033  42.818    .000  98.462

AVER:     .483  26.371    .471   4.234   3.407   5.490    .914    .348  13.648    .195    .038  43.402    .000  99.000
SDEV:     .068    .427    .037    .037   1.789    .439    .018    .008   2.507    .003    .012    .803    .000    .387
SERR:     .034    .213    .018    .018    .894    .220    .009    .004   1.254    .001    .006    .401    .000
%RSD:    14.19    1.62    7.83     .87   52.50    8.00    2.01    2.18   18.37    1.49   31.81    1.85     .00

TDI%:   54.831   -.037    ----   -.154    ----  -1.026    .563    ----    ----    ----    ----    ----    ----
DEV%:      5.9      .6    ----     1.1    ----     2.9     8.2    ----    ----    ----    ----    ----    ----
TDIF:   QUADRA  LINEAR    ----  LINEAR    ----  LINEAR  LINEAR    ----    ----    ----    ----    ----    ----
TDIT:    97.00   48.75    ----   58.00    ----   98.75   37.00    ----    ----    ----    ----    ----    ----
TDII:     87.2  10400.    ----   1897.    ----    169.    98.3    ----    ----    ----    ----    ----    ----


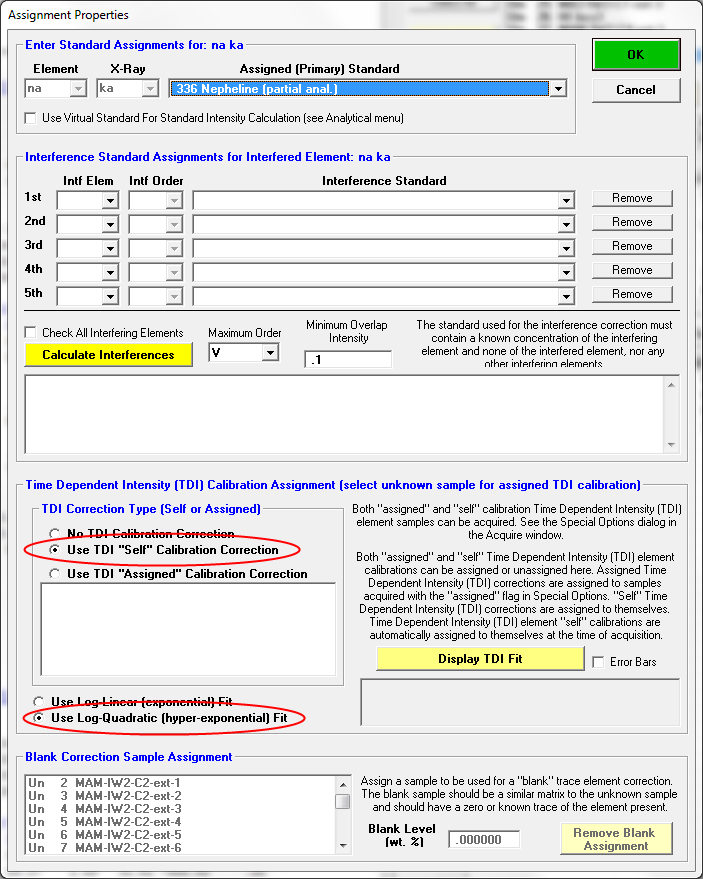
This was accomplished by merely regressing with the "hyper-exponential" fit shown here in the Standard Assignments dialog for Na:


Therefore, one may improve the accuracy of the TDI correction considerably without having to reduce beam current or increase beam diameter, as shown in the "hyper-exponential" fit below:

« Last Edit: October 01, 2013, 10:19:57 PM by John Donovan »
John J. Donovan, Pres. 
(541) 343-3400

"Not Absolutely Certain, Yet Reliable"

John Donovan

  • Administrator
  • Emeritus
  • *****
  • Posts: 3268
  • Other duties as assigned...
    • Probe Software
Re: Time Dependent Intensity (TDI) Corrections
« Reply #2 on: October 01, 2013, 04:55:54 PM »
The importance of the matrix correction in these types of beam sensitive samples (e.g., hydrated) may be illustrated with the following data:

Results in Oxide Weight Percents

ELEM:      CaO     K2O     FeO    SiO2     MgO    Na2O   Al2O3    TiO2    P2O5       O     H2O   SUM 
    58    .411   4.900    .537  74.603    .036   2.644  11.975    .073    .000    .000    .000  95.180
    59    .437   4.624    .612  75.386    .033   1.841  12.024    .113    .000    .000    .000  95.070
    60    .423   4.998    .526  74.715    .023   2.765  12.113    .065    .000    .000    .000  95.628
    61    .423   4.853    .637  75.000    .047   2.137  12.089    .055    .000    .000    .000  95.240
    62    .435   4.847    .677  74.613    .048   2.561  12.089    .036    .011    .000    .000  95.317

AVER:     .426   4.844    .598  74.863    .037   2.390  12.058    .068    .002    .000    .000  95.287
SDEV:     .011    .137    .065    .333    .010    .387    .057    .028    .005    .000    .000
SERR:     .005    .061    .029    .149    .005    .173    .025    .013    .002    .000    .000
%RSD:      2.5     2.8    10.8      .4    27.9    16.2      .5    41.5   223.6   418.3      .0

ZCOR:   1.1202  1.1536  1.1987  1.2061  1.4303  1.8227  1.2568  1.1983  1.4641   .0000   .0000
KRAW:    .0161   .3080   .0057  1.0344   .0003   .1323   .7242   .0006  -.0004   .0000   .0000
PKBG:     4.96   59.36    4.84  370.59    1.42   30.93   77.40    1.46     .87     .00     .00

The above analysis was performed without a TDI correction and also without specifying water in the matrix correction. The water by difference calculation yields approximately 4.7 wt% H2O. Note the average SiO2 and Na2O concentrations highlighted in red for comparison with the results below.

Next we specify the TDI correction as described above and obtain the results shown here:

Results in Oxide Weight Percents

ELEM:      CaO     K2O     FeO    SiO2     MgO    Na2O   Al2O3    TiO2    P2O5       O     H2O   SUM 
    58    .411   4.867    .537  74.378    .037   3.626  12.035    .030    .000    .000    .000  95.921
    59    .437   4.740    .612  75.016    .034   2.426  12.063    .194    .000    .000    .000  95.521
    60    .423   4.933    .526  74.057    .024   3.805  12.178    .076    .000    .000    .000  96.022
    61    .423   5.220    .636  74.552    .048   3.025  12.147    .077    .000    .000    .000  96.128
    62    .435   4.715    .677  74.794    .049   3.503  12.146    .048    .011    .000    .000  96.378

AVER:     .426   4.895    .598  74.559    .038   3.277  12.114    .085    .002    .000    .000  95.994
SDEV:     .011    .203    .065    .370    .010    .557    .062    .064    .005    .000    .000
SERR:     .005    .091    .029    .166    .005    .249    .028    .029    .002    .000    .000
%RSD:      2.5     4.1    10.8      .5    27.3    17.0      .5    75.6   223.6      .0      .0

ZCOR:   1.1198  1.1530  1.1983  1.2092  1.4391  1.8180  1.2625  1.1979  1.4627   .0000   .0000
KRAW:    .0161   .3114   .0057  1.0276   .0003   .1819   .7242   .0008  -.0004   .0000   .0000
PKBG:     4.97   60.00    4.84  369.28    1.43   42.09   77.77    1.58     .87     .00     .00
INT%:      .00     .00     .00     .00     .00     .00     .00     .00     .00     .00     .00
VOL%:     .000   1.135    .000   -.658    .000  36.111    .000  20.283    .000    .000    .000
DEV%:       .0      .2      .0      .0      .0      .4      .0    20.3      .0      .0      .0

The above analysis was performed *with* the TDI correction, but still without specifying water in the matrix correction. The water by difference calculation now yields approximately 4.0 wt% H2O. Note also that due to the TDI correction, the SiO2 concentration has decreased slightly and the Na2O concentration has increased significantly as highlighted in red.

Finally, we specify water in the matrix correction and obtain the results shown here:

Results in Oxide Weight Percents

ELEM:      CaO     K2O     FeO    SiO2     MgO    Na2O   Al2O3    TiO2    P2O5       O     H2O   SUM 
    58    .414   4.885    .542  74.776    .039   3.668  12.139    .030    .000    .000   3.506 100.000
    59    .441   4.759    .618  75.464    .036   2.457  12.181    .195    .000    .000   3.849 100.000
    60    .426   4.951    .531  74.441    .026   3.848  12.281    .076    .000    .000   3.420 100.000
    61    .426   5.239    .641  74.934    .050   3.058  12.249    .077    .000    .000   3.327 100.000
    62    .438   4.730    .682  75.149    .051   3.539  12.240    .048    .011    .000   3.112 100.000

AVER:     .429   4.913    .603  74.953    .041   3.314  12.218    .085    .002    .000   3.443 100.000
SDEV:     .011    .203    .065    .385    .010    .562    .057    .065    .005    .000    .270
SERR:     .005    .091    .029    .172    .005    .251    .025    .029    .002    .000    .121
%RSD:      2.5     4.1    10.8      .5    25.7    16.9      .5    75.6   223.6  -104.6     7.9

ZCOR:   1.1241  1.1571  1.2053  1.2156  1.4515  1.8372  1.2731  1.2037  1.4591   .0000   .0000
KRAW:    .0161   .3114   .0057  1.0276   .0004   .1821   .7244   .0008  -.0004   .0000   .0000
PKBG:     5.03   60.00    4.89  372.20    1.46   43.35   78.99    1.58     .87     .00     .00
INT%:      .00     .00     .00     .00     .00     .00     .00     .00     .00     .00     .00
VOL%:     .000   1.135    .000   -.658    .000  36.111    .000  20.283    .000    .000    .000
DEV%:       .0      .2      .0      .0      .0      .4      .0    20.3      .0      .0      .0

It is quite interesting to note that by simply adding water to the matrix correction, the concentration of the Si is significantly increased resulting in a water by difference calculation that now yields approximately 3.4 wt% H2O. Note that both the average SiO2 and Na2O concentrations have increased as seen highlighted in red.

This is due to the fact that water (mostly oxygen) absorbs Si Ka (and most of the other emission lines here) more strongly than Si, thus resulting in larger Si (and other elements) and smaller H2O values when the matrix effects of H2O are included in the matrix correction.
« Last Edit: October 02, 2013, 11:06:53 AM by John Donovan »
John J. Donovan, Pres. 
(541) 343-3400

"Not Absolutely Certain, Yet Reliable"

John Donovan

  • Administrator
  • Emeritus
  • *****
  • Posts: 3268
  • Other duties as assigned...
    • Probe Software
Re: Time Dependent Intensity (TDI) Corrections
« Reply #3 on: October 04, 2013, 09:47:37 AM »
Don't forget your beam sensitive standards!

By checking the little box here in the Special Options dialog (from Acquire!) (thanks to Paul Carpenter for the idea):


you can also perform TDI corrections on your beam sensitive standards. E.g., anhydrite, apatite, etc:


However, note that Ca here could be perhaps better fit using the quadratic (hyper-exponential) fit as seen here:


Also, if you are measuring oxygen, this element intensity is often affected by beam damage:


Happy probing!
John J. Donovan, Pres. 
(541) 343-3400

"Not Absolutely Certain, Yet Reliable"

Richard Walshaw

  • Post Doc
  • ***
  • Posts: 19
Re: Time Dependent Intensity (TDI) Corrections
« Reply #4 on: February 19, 2014, 09:04:40 AM »
Hi All

I'm looking through the literature to get a feel for who's done what using the TDI correction in PfEPMA.
Can you please point me toward any recent (not old) publications you know about or have written.

Thanks

Richard
"Stay out of the black and in the red...there's nothing in this game for two in a bed." - Albert Einstein

Probeman

  • Emeritus
  • *****
  • Posts: 2831
  • Never sleeps...
    • John Donovan
Re: Time Dependent Intensity (TDI) Corrections
« Reply #5 on: February 19, 2014, 12:32:35 PM »
I'm looking through the literature to get a feel for who's done what using the TDI correction in PfEPMA.
Can you please point me toward any recent (not old) publications you know about or have written.

I have to issue a big apology here.    :'(

I have been swamped these last few years with other work and have not taken the time to properly document the new TDI methods I've developed recently and which are still on going...   ;D

Normally, I try to publish everything that is worthwhile, primarily so it is scientifically documented, but also so every feature in the software gets its proper "bona fides" so to speak!

I have asked a couple of younger colleagues to help me write up these TDI methods into a full paper but that process has only just got going last year, though we hope to have something finished this year.

In the meantime I have some links to abstracts here:

Glass abstract with Michael Rowe:
http://epmalab.uoregon.edu/pdfs/gold2005_Donovan.pdf

The presentation for the above abstract:
http://epmalab.uoregon.edu/reports/Improving%20Glass%20Analyses.pdf

A white paper on TDI effects when measuring Na, Si and O in hydrous glasses (method of B. Nash, et al.):
http://epmalab.uoregon.edu/reports/Withers%20hydrous%20glass.pdf
« Last Edit: February 19, 2014, 07:54:38 PM by John Donovan »
The only stupid question is the one not asked!

Probeman

  • Emeritus
  • *****
  • Posts: 2831
  • Never sleeps...
    • John Donovan
Re: Time Dependent Intensity (TDI) Corrections
« Reply #6 on: March 10, 2014, 04:21:01 PM »
Here is some additional explanation of the log window output for TDI sample quantitative correction results:

Un   27 MAM IW2 C4-ext-1, Results in Elemental Weight Percents
 
ELEM:       Na      Si       K      Al      Mg      Ca      Ti      Mn      Fe       P      Cr       O       H
TYPE:     ANAL    ANAL    ANAL    ANAL    ANAL    ANAL    ANAL    ANAL    ANAL    ANAL    ANAL    CALC    SPEC
BGDS:      MAN     MAN     LIN     MAN     MAN     MAN     LIN     LIN     MAN     EXP     LIN
TIME:    79.98   29.98   40.00   40.00   60.00   80.00   20.00   20.00   60.00   60.00   30.00
BEAM:    20.09   20.09   20.09   20.09   20.09   20.09   20.09   20.09   20.09   20.09   20.09

ELEM:       Na      Si       K      Al      Mg      Ca      Ti      Mn      Fe       P      Cr       O       H   SUM 
   223    .507  25.693    .391   4.354   4.390   5.922   1.025    .385  12.555    .207    .024  43.328    .000  98.780
   224    .256  25.891    .329   4.272   4.917   5.856    .863    .372  10.511    .181    .032  42.976    .000  96.457
   225    .333  26.002    .390   4.423   3.930   6.318   1.008    .340  12.968    .196    .032  43.620    .000  99.559
   226    .351  25.804    .379   4.197   4.793   5.837    .954    .338  12.482    .191    .055  43.403    .000  98.784
   227    .289  26.034    .374   4.350   5.419   5.865    .955    .338  11.326    .193    .046  43.869    .000  99.057
   228    .308  25.807    .365   4.239   4.010   6.126    .903    .333  13.373    .186    .037  43.230    .000  98.918

AVER:     .341  25.872    .371   4.306   4.577   5.987    .951    .351  12.203    .193    .037  43.404    .000  98.593
SDEV:     .088    .130    .023    .084    .574    .194    .061    .022   1.076    .009    .011    .310    .000   1.085
SERR:     .036    .053    .009    .034    .234    .079    .025    .009    .439    .004    .005    .127    .000
%RSD:    25.76     .50    6.16    1.95   12.54    3.24    6.43    6.15    8.82    4.60   29.73     .72     .00
STDS:      336     162     374     336     162     162      22      25     162     285     396       0       0

STKF:    .0735   .2018   .1132   .1331   .0568   .1027   .5547   .7341   .0950   .1599   .3050   .0000   .0000
STCT:   2515.7 10026.0  6009.1  8230.4  2834.3   337.0  6393.2 14939.3   599.4  9652.2  5184.8      .0      .0

UNKF:    .0016   .2045   .0034   .0306   .0293   .0557   .0082   .0029   .1039   .0014   .0003   .0000   .0000
UNCT:     55.4 10158.6   178.3  1893.2  1460.9   182.6    94.5    59.8   655.3    82.5     5.6      .0      .0
UNBG:     10.4     9.8    30.1    28.5    19.0     1.5     7.6    19.2     8.0    39.1    14.8      .0      .0

ZCOR:   2.1042  1.2653  1.1057  1.4062  1.5655  1.0759  1.1608  1.1946  1.1745  1.4095  1.1305   .0000   .0000
KRAW:    .0220  1.0132   .0297   .2300   .5154   .5420   .0148   .0040  1.0933   .0085   .0011   .0000   .0000
PKBG:     6.34 1039.69    6.95   67.51   77.70  126.12   13.71    4.12   82.50    3.12    1.39     .00     .00
INT%:     ----    ----    ----    ----    -.11    ----    ----    ----     .00    ----    ----    ----    ----

TDI%:   39.559   -.098    ----   -.185    ----  -1.692   -.502    ----    ----    ----    ----    ----    ----
DEV%:      4.8      .6    ----     1.1    ----     2.6     7.5    ----    ----    ----    ----    ----    ----
TDIF:   QUADRA  LINEAR    ----  LINEAR    ----  LINEAR  LINEAR    ----    ----    ----    ----    ----    ----
TDIT:    98.33   49.83    ----   58.33    ----   98.33   37.83    ----    ----    ----    ----    ----    ----
TDII:     64.7  10169.    ----   1921.    ----    184.    102.    ----    ----    ----    ----    ----    ----


Here is a "key":


The only stupid question is the one not asked!

John Donovan

  • Administrator
  • Emeritus
  • *****
  • Posts: 3268
  • Other duties as assigned...
    • Probe Software
Re: Time Dependent Intensity (TDI) Corrections
« Reply #7 on: June 11, 2014, 12:20:03 PM »
Here's a TDI plot for some points in a high crystallized basalt where the student was trying to find the residual glass chemistry, but often hit some crystals.

Even though the chemistry of the two phases are very similar, the glass compositions are easily distinguished from the crystal compositions:

John J. Donovan, Pres. 
(541) 343-3400

"Not Absolutely Certain, Yet Reliable"

Gareth D Hatton

  • Professor
  • ****
  • Posts: 51
Re: Time Dependent Intensity (TDI) Corrections
« Reply #8 on: June 12, 2014, 06:56:48 AM »
That is very nice  8)

Probeman

  • Emeritus
  • *****
  • Posts: 2831
  • Never sleeps...
    • John Donovan
Re: Time Dependent Intensity (TDI) Corrections
« Reply #9 on: December 18, 2014, 12:38:36 PM »
This is an "extreme" situation, but if you ever have to characterize a Na rich glass such as NIST K-375 (which would never occur naturally I think!), the TDI correction in PFE will come to your rescue. In this case even the linear and hyper exponential TDI regressions will under fit this type of Na loss over time.

But the double exponential TDI correction seen here:


can offer some help, though this is a scary extrapolation for sure as you can see:


Basically in this case, one is losing over 50% of the Na intensity in less than 8 seconds after the faraday cup is removed!

How accurate is the extrapolation this particular case?  I hesitate to reveal, but....  all in the name of science, here it is:

St  173 Set  24 K-0375 NBS glass
TakeOff = 40.0  KiloVolt = 15.0  Beam Current = 100.  Beam Size =   10
(Magnification (analytical) =  40000),        Beam Mode = Analog  Spot
(Magnification (default) =      400, Magnification (imaging) =    800)
Image Shift (X,Y):                                          .00,   .00

Number of Data Lines:   5             Number of 'Good' Data Lines:   5
First/Last Date-Time: 05/10/2012 02:30:56 AM to 05/10/2012 02:38:17 AM
WARNING- Using Exponential Off-Peak correction for si ka
WARNING- Using Exponential Off-Peak correction for p ka
WARNING- Using Time Dependent Intensity (TDI) Element Correction
WARNING- Using Time Dependent Intensity (TDI) Weighting Factor of  10

Average Total Oxygen:         .000     Average Total Weight%:   98.935
Average Calculated Oxygen:    .000     Average Atomic Number:   16.454
Average Excess Oxygen:        .000     Average Atomic Weight:   22.833
Average ZAF Iteration:        4.00     Average Quant Iterate:     2.00

St  173 Set  24 K-0375 NBS glass, Results in Elemental Weight Percents
 
ELEM:       Na      Si      Ca      Fe       P      Zn      Ba       U       O
TYPE:     ANAL    ANAL    ANAL    ANAL    ANAL    SPEC    SPEC    SPEC    SPEC
BGDS:      LIN     EXP     LIN     LIN     EXP
TIME:    20.00   20.00   20.00   20.00   20.00
BEAM:   100.72  100.72  100.72  100.72  100.72

ELEM:       Na      Si      Ca      Fe       P      Zn      Ba       U       O   SUM 
   371   9.539  32.765    .001    .007    .004   4.940  10.370    .110  42.320 100.056
   372   8.727  32.573    .005   -.008    .012   4.940  10.370    .110  42.320  99.049
   373   9.551  32.345    .008   -.014    .014   4.940  10.370    .110  42.320  99.644
   374   8.440  32.289    .001   -.029    .008   4.940  10.370    .110  42.320  98.450
   375   7.829  31.913    .001    .013   -.021   4.940  10.370    .110  42.320  97.476

AVER:    8.817  32.377    .003   -.006    .003   4.940  10.370    .110  42.320  98.935
SDEV:     .739    .321    .003    .017    .014    .000    .000    .000    .000   1.017
SERR:     .331    .144    .001    .008    .006    .000    .000    .000    .000
%RSD:     8.38     .99   89.41 -273.00  412.33     .00     .00     .00     .00

PUBL:   10.420  31.830    n.a.    n.a.    n.a.   4.940  10.370    .110  42.320  99.990
%VAR:   -15.38    1.72     ---     ---     ---     .00     .00     .00     .00
DIFF:   -1.603    .547     ---     ---     ---    .000    .000    .000    .000
STDS:      336      14     285     162     285       0       0       0       0

STKF:    .0735   .4101   .3596   .0950   .1599   .0000   .0000   .0000   .0000
STCT:    78.78   80.11  605.49   66.49   40.15     .00     .00     .00     .00

UNKF:    .0427   .2552   .0000  -.0001   .0000   .0000   .0000   .0000   .0000
UNCT:    45.72   49.86     .05    -.04     .01     .00     .00     .00     .00
UNBG:     3.34     .16    1.23     .99     .05     .00     .00     .00     .00

ZCOR:   2.0679  1.2685  1.0646  1.1515  1.4651   .0000   .0000   .0000   .0000
KRAW:    .5803   .6224   .0001  -.0006   .0001   .0000   .0000   .0000   .0000
PKBG:    14.69  308.09    1.04     .97    1.26     .00     .00     .00     .00

TDI%: 4918.968  -8.230   1.354    ----    ----    ----    ----    ----    ----
DEV%:      9.8      .4    32.9    ----    ----    ----    ----    ----    ----
TDIF:  LOG-LOG LOG-LOG LOG-LIN    ----    ----    ----    ----    ----    ----
TDIT:    74.20   74.40   71.80    ----    ----    ----    ----    ----    ----
TDII:     45.6    49.9    1.29    ----    ----    ----    ----    ----    ----


So, ok we are off by some 15% relative error for Na, *but* the TDI% correction is almost 5000%. That is not a typo!    :o

And... we are *still* under fitting the data!  How about a triple exponential, anyone?

That is what happens when you use a 100 nA beam on such a beam sensitive material...
« Last Edit: December 18, 2014, 01:47:22 PM by Probeman »
The only stupid question is the one not asked!

JohnF

  • Professor
  • ****
  • Posts: 105
  • CQ DX DE WA3BTA
    • John's EPMA
Re: Problem with Time Dependent Intensity (TDI) Corrections: turning it off.
« Reply #10 on: January 06, 2015, 09:58:01 AM »
I am trying to toggle the TDI on and off to see "what if". I am using the 9.6.3 PfE flavor on our SX51 which will continue operation for several more years. Regardless of _3_ ways of trying to turn off the TDI to see what the integrated count would be, nothing seems to work. The 3 ways are (1) in the Analytical/Analysis Options, uncheck the Use assigned or Self TDI corrections on Unknown box, (2) Assignment properties, click the No TDI Califbration Correction radio button, (3) under Standard and Interference Assignments, click the Remove TDI Correction. Have other people successfully been able to 'turn off' and see the difference in counts?? No matter what I do, I see the same counts. I am using "Self" Calibration.  I have imported the mdb file into a "modern" 10.5.3 version and see the same behavior. Suggestions?

Probeman

  • Emeritus
  • *****
  • Posts: 2831
  • Never sleeps...
    • John Donovan
Re: Problem with Time Dependent Intensity (TDI) Corrections: turning it off.
« Reply #11 on: January 06, 2015, 11:04:36 AM »
I am trying to toggle the TDI on and off to see "what if". I am using the 9.6.3 PfE flavor on our SX51 which will continue operation for several more years. Regardless of _3_ ways of trying to turn off the TDI to see what the integrated count would be, nothing seems to work. The 3 ways are (1) in the Analytical/Analysis Options, uncheck the Use assigned or Self TDI corrections on Unknown box, (2) Assignment properties, click the No TDI Califbration Correction radio button, (3) under Standard and Interference Assignments, click the Remove TDI Correction. Have other people successfully been able to 'turn off' and see the difference in counts?? No matter what I do, I see the same counts. I am using "Self" Calibration.  I have imported the mdb file into a "modern" 10.5.3 version and see the same behavior. Suggestions?

John,
The way to tell if the TDI corrections are on or off is to look for this output in the log window when the quant is calculated:

TDI%:    5.145    .038    ----    .222    ----    .434   -.063    ----    ----    ----    ----    ----    ----
DEV%:       .4      .1    ----      .1    ----      .4     1.0    ----    ----    ----    ----    ----    ----
TDIF:  LOG-LIN LOG-LIN    ---- LOG-LIN    ---- LOG-LIN LOG-LIN    ----    ----    ----    ----    ----    ----
TDIT:    99.17   49.67    ----   58.33    ----   98.50   37.67    ----    ----    ----    ----    ----    ----
TDII:     254.   9873.    ----   3037.    ----    230.    146.    ----    ----    ----    ----    ----    ----


You can also use the Remove TDI Correction button from the Standard Assignments dialog.
The only stupid question is the one not asked!

John Donovan

  • Administrator
  • Emeritus
  • *****
  • Posts: 3268
  • Other duties as assigned...
    • Probe Software
Re: Time Dependent Intensity (TDI) Corrections
« Reply #12 on: March 20, 2015, 04:33:00 PM »
I'm assuming this error is a result of poor sequencing choices on my part, so obviously I need to structure my future setups so that no TDI's are needed for the last-measured sample of any "Combine Samples" projects. In this case, the elements for which TDI's were really necessary were all the second sample because... well, I'm an idiot. However, if anyone can suggest a workaround, I'd be mighty grateful.

Hi Owen,
Sad to say, the "loose nut behind the wheel" in this case is me!

I'll have to add code to handle the TDI intensities in the second sample.  The issue is I need to properly re-normalize the TDI intensities from the 2nd condition to be consistent with the first sample conditions.

Please send me a small MDB file example of the issue and I will work on it ASAP.

Thanks!
john
John J. Donovan, Pres. 
(541) 343-3400

"Not Absolutely Certain, Yet Reliable"

Probeman

  • Emeritus
  • *****
  • Posts: 2831
  • Never sleeps...
    • John Donovan
Re: Time Dependent Intensity (TDI) Corrections (Absorbed current)
« Reply #13 on: March 30, 2015, 01:17:27 PM »
I took a shot this morning and acquired some time dependent intensity (TDI) data on the NBS K-373 and K-375 Na-Zn-Ba silicate glasses. Conditions were 15 keV, 30 nA and 5 um beam. 20 TDI and absorbed current measurements were made over a 30 sec counting time (using MAN bgds) as seen here:


and here:


Because of the extreme beam sensitivity of these two materials (10.4 elemental wt% Na), the double exponential (log-log), extrapolation to zero time is required. Quantification gives the following results for K-373:

ELEM:       Na      Si      Zn      Ba       U       O   SUM 
    10   9.772  31.850   4.940  10.380    .054  42.340  99.336
    11   9.944  31.850   4.940  10.380    .054  42.340  99.508
    12   9.336  31.850   4.940  10.380    .054  42.340  98.900

AVER:    9.684  31.850   4.940  10.380    .054  42.340  99.248
SDEV:     .314    .000    .000    .000    .000    .000    .314
SERR:     .181    .000    .000    .000    .000    .000
%RSD:     3.24     .00     .00     .00     .00     .00

PUBL:   10.430  31.850   4.940  10.380    .054  42.340  99.994
%VAR:    -7.15     .00     .00     .00     .00     .00
DIFF:    -.746    .000    .000    .000    .000    .000
STDS:      301       0       0       0       0       0

STKF:    .0510   .0000   .0000   .0000   .0000   .0000
STCT:   2902.3      .0      .0      .0      .0      .0

UNKF:    .0470   .0000   .0000   .0000   .0000   .0000
UNCT:   2671.4      .0      .0      .0      .0      .0
UNBG:     27.7      .0      .0      .0      .0      .0

ZCOR:   2.0624   .0000   .0000   .0000   .0000   .0000
KRAW:    .9204   .0000   .0000   .0000   .0000   .0000
PKBG:    97.30     .00     .00     .00     .00     .00

TDI%:  270.919    ----    ----    ----    ----    ----
DEV%:       .6    ----    ----    ----    ----    ----
TDIF:  LOG-LOG    ----    ----    ----    ----    ----
TDIT:    53.67    ----    ----    ----    ----    ----
TDII:    2698.    ----    ----    ----    ----    ----


and here for K-375:

ELEM:       Na      Si      Zn      Ba       U       O   SUM 
    13   9.460  31.830   4.940  10.370    .110  42.320  99.030
    14   8.583  31.830   4.940  10.370    .110  42.320  98.153
    15   9.695  31.830   4.940  10.370    .110  42.320  99.265

AVER:    9.246  31.830   4.940  10.370    .110  42.320  98.816
SDEV:     .586    .000    .000    .000    .000    .000    .586
SERR:     .339    .000    .000    .000    .000    .000
%RSD:     6.34     .00     .00     .00     .00     .00

PUBL:   10.420  31.830   4.940  10.370    .110  42.320  99.990
%VAR:   -11.27     .00     .00     .00     .00     .00
DIFF:   -1.174    .000    .000    .000    .000    .000
STDS:      301       0       0       0       0       0

STKF:    .0510   .0000   .0000   .0000   .0000   .0000
STCT:   2902.3      .0      .0      .0      .0      .0

UNKF:    .0447   .0000   .0000   .0000   .0000   .0000
UNCT:   2543.9      .0      .0      .0      .0      .0
UNBG:     27.8      .0      .0      .0      .0      .0

ZCOR:   2.0680   .0000   .0000   .0000   .0000   .0000
KRAW:    .8765   .0000   .0000   .0000   .0000   .0000
PKBG:    92.61     .00     .00     .00     .00     .00

TDI%:  236.546    ----    ----    ----    ----    ----
DEV%:       .6    ----    ----    ----    ----    ----
TDIF:  LOG-LOG    ----    ----    ----    ----    ----
TDIT:    52.67    ----    ----    ----    ----    ----
TDII:    2568.    ----    ----    ----    ----    ----


Although the relative accuracy errors are still around 10%, the TDI correction is over 200%!  What does that mean?  Well, it means that if you didn't use the TDI correction, you'd get a roughly 70% error, even with these relatively mild conditions:

ELEM:       Na      Si      Zn      Ba       U       O   SUM 
    13   2.929  31.830   4.940  10.370    .110  42.320  92.499
    14   2.866  31.830   4.940  10.370    .110  42.320  92.436
    15   2.852  31.830   4.940  10.370    .110  42.320  92.422

AVER:    2.882  31.830   4.940  10.370    .110  42.320  92.452
SDEV:     .041    .000    .000    .000    .000    .000    .041
SERR:     .024    .000    .000    .000    .000    .000
%RSD:     1.41     .00     .00     .00     .00     .00

PUBL:   10.420  31.830   4.940  10.370    .110  42.320  99.990
%VAR:   -72.34     .00     .00     .00     .00     .00
DIFF:   -7.538    .000    .000    .000    .000    .000
STDS:      301       0       0       0       0       0


But I'm also curious about the fact that the two very similar materials show changes in absorbed current that are opposite of each other even though they have just a slight difference in uranium content.
The only stupid question is the one not asked!

Probeman

  • Emeritus
  • *****
  • Posts: 2831
  • Never sleeps...
    • John Donovan
Re: Time Dependent Intensity (TDI) Corrections (Absorbed current)
« Reply #14 on: March 30, 2015, 02:23:19 PM »
Although the relative accuracy errors are still around 10%, the TDI correction is over 200%!  What does that mean?  Well, it means that if you didn't use the TDI correction, you'd get a roughly 70% error, even with these relatively mild conditions...

Here are the same data but with the "TDI weighting" feature applied as seen here:


Here are the results for the K-373 standard. Note that we now obtain around 5% relative accuracy even with an almost 300% TDI correction!

ELEM:       Na      Si      Zn      Ba       U       O   SUM 
    10   9.992  31.850   4.940  10.380    .054  42.340  99.556
    11  10.468  31.850   4.940  10.380    .054  42.340 100.032
    12   9.130  31.850   4.940  10.380    .054  42.340  98.694

AVER:    9.864  31.850   4.940  10.380    .054  42.340  99.428
SDEV:     .678    .000    .000    .000    .000    .000    .678
SERR:     .392    .000    .000    .000    .000    .000
%RSD:     6.88     .00     .00     .00     .00     .00

PUBL:   10.430  31.850   4.940  10.380    .054  42.340  99.994
%VAR:    -5.43     .00     .00     .00     .00     .00
DIFF:    -.566    .000    .000    .000    .000    .000
STDS:      301       0       0       0       0       0

STKF:    .0510   .0000   .0000   .0000   .0000   .0000
STCT:   2939.1      .0      .0      .0      .0      .0

UNKF:    .0479   .0000   .0000   .0000   .0000   .0000
UNCT:   2758.6      .0      .0      .0      .0      .0
UNBG:     27.8      .0      .0      .0      .0      .0

ZCOR:   2.0602   .0000   .0000   .0000   .0000   .0000
KRAW:    .9386   .0000   .0000   .0000   .0000   .0000
PKBG:   100.40     .00     .00     .00     .00     .00

TDI%:  283.286    ----    ----    ----    ----    ----
DEV%:       .5    ----    ----    ----    ----    ----
TDIF:  LOG-LOG    ----    ----    ----    ----    ----
TDIT:    53.67    ----    ----    ----    ----    ----
TDII:    2781.    ----    ----    ----    ----    ----


This is what it looks like with the weighted fitting.  Still slightly, slightly under fit...


Note that this is a log-log (double exponential) fit and still not quite enough curvature.  Now that's what I call Na loss!   But as long as the precision of our measurements are good enough, we can continue to push our modeling accuracy.
« Last Edit: March 30, 2015, 10:15:04 PM by John Donovan »
The only stupid question is the one not asked!