Author Topic: Time Dependent Intensity (TDI) Corrections  (Read 26961 times)

BenH

  • Post Doc
  • ***
  • Posts: 12
Re: Time Dependent Intensity (TDI) Corrections
« Reply #45 on: May 15, 2019, 10:54:34 AM »
I used the user specified output and selected relative error.

John Donovan

  • Administrator
  • Emeritus
  • *****
  • Posts: 3268
  • Other duties as assigned...
    • Probe Software
Re: Time Dependent Intensity (TDI) Corrections
« Reply #46 on: May 15, 2019, 11:02:05 AM »
Hi Ben,
I don't see relative error in that dialog.  Did you mean sample standard deviation and/or sample standard error?
John J. Donovan, Pres. 
(541) 343-3400

"Not Absolutely Certain, Yet Reliable"

BenH

  • Post Doc
  • ***
  • Posts: 12
Re: Time Dependent Intensity (TDI) Corrections
« Reply #47 on: May 15, 2019, 11:11:24 AM »
"analytical errors in relative percents" in the user specified format output.


John Donovan

  • Administrator
  • Emeritus
  • *****
  • Posts: 3268
  • Other duties as assigned...
    • Probe Software
Re: Time Dependent Intensity (TDI) Corrections
« Reply #48 on: May 15, 2019, 12:15:15 PM »
Hi Ben,
Ah, OK.

So as you know, these are the analytical sensitivities calculated using the method of Love/Scott, as seen here from the PFE Reference manual:


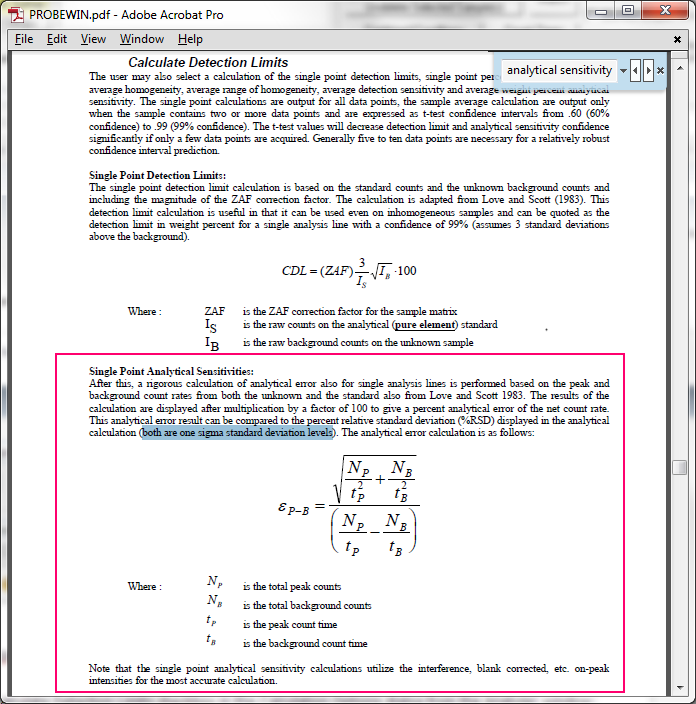
These analytical sensitivity errors are basically a sort of peak to background estimation which according to Love/Scott are predictive as to knowing that two numbers are statistically different from each other, as opposed to simply variances in the counting statistics.

In our implementation of this equation we utilize any corrections that have been applied to the raw data that changes the net intensities, in order to be somewhat more accurate in the analytical sensitivity estimates. This includes changes to the net intensities due to the spectral interference, APF, MAN and TDI corrections (and probably a few other corrections).

Now if I pick a (very) beam sensitive sample, specifically the NIST K-375 glass, and output the results *without* the TDI correction I get these results:


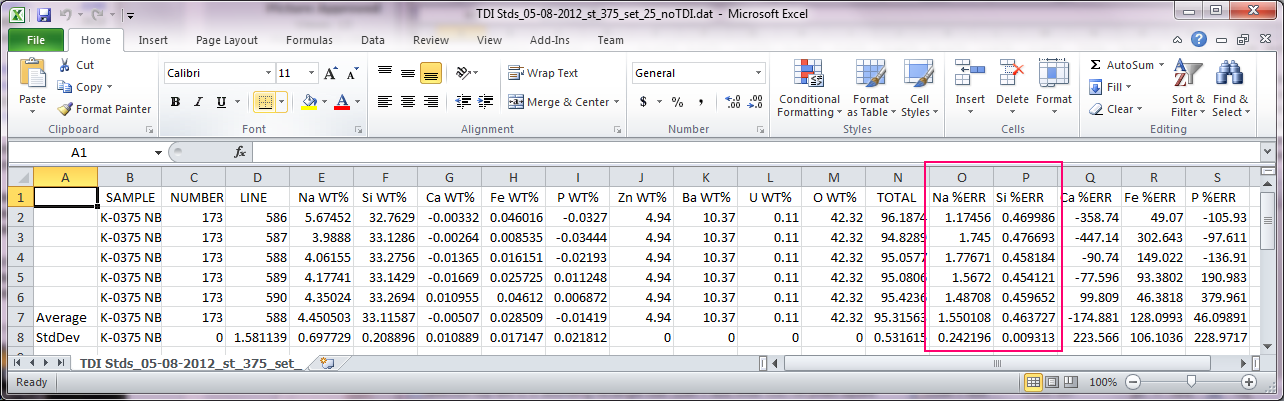
Note that the Na and Si average analytical sensitivity errors are 1.550108 and 0.463727 respectively. Now with the TDI correction turned on I get:


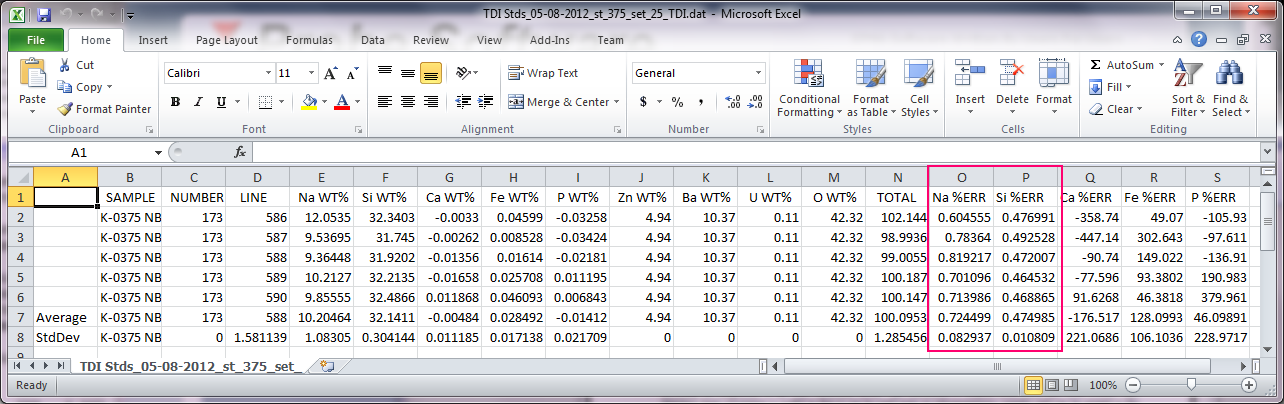
Now note that the average analytical sensitivity errors are now 0.724499 and 0.474985 respectively. They are smaller for Na because due to the slope of the TDI corrections, so the net intensity was increased and the analytical sensitivity improved, because the peak to bgd improved. And for Si, the net intensities were instead decreased, because of the different slope for the Si TDI corrections.  That is, due to the TDI corrections, the Na P/B increased (a lot), but the Si P/B decreased (slightly).

So I cannot explain why you are not seeing much of a change in your analytical sensitivities from the TDI corrections, unless your TDI corrections are very small.

You asked about the TDI fit deviation and the answer is that the variance due to the regression scatter in the TDI plot is not applied in this calculation. There are however several different options for outputing the TDI correction magnitude and fit variance as seen here:


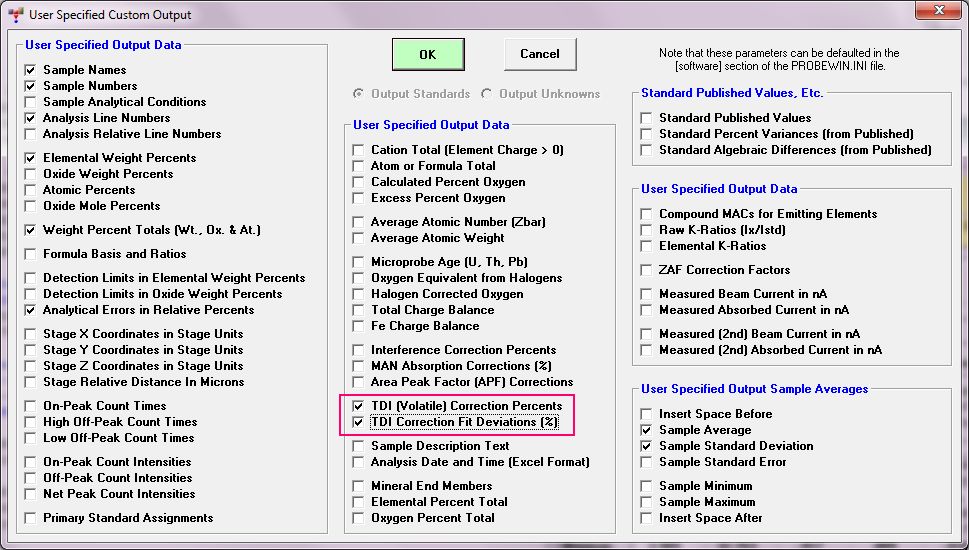
I would have to think if there is a way the TDI fit variance could be applied to the analytical sensitivity calculation, but in the meantime you might want to look at the output from the Output | Save Time Dependent Intensities menu. This output option saves a lot of parameters utilized in the TDI corrections to a tab delimited file.  I know several users have leveraged this information in their own TDI studies.

By the way, this variation in the TDI correction from point to point is exactly why the "assigned TDI" (as opposed to the "self TDI") correction was created. Basically Ian Carmichael at UC Berkeley wanted a TDI correction that utilized a constant slope TDI correction for each data point in a sample, so that he could be sure that the variation between data points was due to the composition changing, as opposed to the statistics bouncing around from one data point to the next.

The reason almost nobody uses the "assigned" TDI correction is that due to all kinds of different ion migration physics, even a fairly homogeneous sample can show statistically significant variation from one acquisition to the next.

https://probesoftware.com/smf/index.php?topic=116.msg454#msg454

john
« Last Edit: May 15, 2019, 03:16:52 PM by John Donovan »
John J. Donovan, Pres. 
(541) 343-3400

"Not Absolutely Certain, Yet Reliable"

Probeman

  • Emeritus
  • *****
  • Posts: 2831
  • Never sleeps...
    • John Donovan
Re: Time Dependent Intensity (TDI) Corrections
« Reply #49 on: May 17, 2019, 01:10:55 PM »
I would sum up the above by noting that the analytical sensitivity calculation by Love/Scott is essentially a description of the P/B ratio for an individual data point, which is affected by the slopes of the TDI corrections for each element, since the TDI correction can change the net intensity, but not the bgd intensity. So the TDI correction changes the analytical sensitivity of each data point and is calculated for each data point separately.

While the standard deviation is a description of the point to point variation for all data points in a sample. These individual data points are affected by the TDI correction of each point, but not in a systematic manner. That is, the TDI correction might amplify the statistical variance in the TDI curves if the variation in the TDI calibration curves are essentially random variation, but the TDI correction might also not change the variance of the data points much at all, if the TDI curves are very consistent from point to point.

Hope that helps.
« Last Edit: May 17, 2019, 03:18:19 PM by Probeman »
The only stupid question is the one not asked!

Hwayoung Kim

  • Graduate
  • **
  • Posts: 8
Re: Time Dependent Intensity (TDI) Corrections
« Reply #50 on: January 22, 2020, 05:43:50 PM »
I've been measuring Na intensity loss from silicate glasses with self TDI correction. And I have one question how the final Na X-ray intensities were calculated.

"Note that the linear TDI correction utilizes only the slope of the TDI fit in log space. However the “hyperexponential” TDI correction utilizes the actual intercept of the 2nd order quadratic fit to the TDI data."

This is what I read from the User Reference Manual and I understood that extrapolated y-intercept at t=0 was finally used for matrix correction calculation when I use Quadratic (Hyper-Exponential) fitting. However, after I Analyze TDI corrected sample, I found out that X-ray counts of Na at "UNCT" row and "TDII" row are quite different.


Could you explain how the final intensity at "UNCT" row are calculated from the y-intercept intensity at "TDII" row??

« Last Edit: January 22, 2020, 05:51:46 PM by Hwayoung Kim »
Hwayoung Kim
Korea Polar Research Institute (KOPRI), South Korea
JEOL JXA-8530F

John Donovan

  • Administrator
  • Emeritus
  • *****
  • Posts: 3268
  • Other duties as assigned...
    • Probe Software
Re: Time Dependent Intensity (TDI) Corrections
« Reply #51 on: January 23, 2020, 10:05:57 AM »
Hi Hwayoung,
You are exactly correct!  I had not updated the reference manual after we modified the code a couple of years ago to handle using duplicate elements (aggregate feature) with the TDI correction.  Basically one can't average quadratic slopes!  So now the reference manual says:

Note that the linear TDI correction utilizes only the slope of the TDI fit in log space. However the “hyper-exponential” TDI correction utilizes a 2nd order quadratic fit to the TDI data. While the log-log (double exponential) fit utilizes only the slope fit term similar to the log-linear fit, but with a LOG(elapsed-time) term.

Here is the source code for the calculation:

atemp! = (sample(1).VolCountTimesStop(linerow%, chan%) - sample(1).VolCountTimesStart(linerow%, chan%)) * SECPERDAY#

' Calculate log linear TDI fit
If sample(1).VolatileFitTypes%(chan%) = 0 Then
voluncts! = Log(uncts!) - sample(1).VolatileFitSlopes!(chan%) * (atemp! / 2#)

' Calculate hyper exponential TDI fit (quadratic)
ElseIf sample(1).VolatileFitTypes%(chan%) = 1 Then
voluncts! = Log(uncts!) - sample(1).VolatileFitSlopes!(chan%) * (atemp! / 2#) - sample(1).VolatileFitCurvatures!(chan%) * (atemp! / 2#) ^ 2

' Calculate double exponential TDI fit (logarithmic)
ElseIf sample(1).VolatileFitTypes%(chan%) = 2 Then
voluncts! = Log(uncts!) - sample(1).VolatileFitSlopes!(chan%) * Log(atemp! / 2#)
End If

You can get the updated reference manual by updating Probe for EPMA from the Help menu as usual.  See the latest changes here:

https://probesoftware.com/smf/index.php?topic=40.0

Note that you are attributed in the version.txt file!  Please let me know if you have any further questions.
« Last Edit: January 23, 2020, 01:52:29 PM by John Donovan »
John J. Donovan, Pres. 
(541) 343-3400

"Not Absolutely Certain, Yet Reliable"

Andrew Mott

  • Post Doc
  • ***
  • Posts: 11
Re: Time Dependent Intensity (TDI) Corrections
« Reply #52 on: March 22, 2021, 09:16:10 AM »
I'm working with a very beam sensitive mineral and I am using TDI corrections, especially for Na and Al. For most of my analyses the log-linear or quadratic-linear TDI corrections work very well and there are only minor differences (+/- 1) between the Linear-Linear Y intercept and the Log-Linear or Log-Quadratic Y intercept. However, in some of my especially Na-rich analyses there is a significant difference between the Y-intercept on the Linear-Linear chart and the Y-intercept on the Log-Linear chart, with the resulting Log-Linear correction (I believe) overestimating Na.

In my example, the Y intercept for Linear-Linear is 53, while the Y intercept for Log-Linear is 59

Is there any way to add an option to use a Linear-Linear correction or as an added question is there any way to ask the software use Point 1 as the only analytical point if you have an odd analysis with points producing a weird model?

Thank you for your time.

Probeman

  • Emeritus
  • *****
  • Posts: 2831
  • Never sleeps...
    • John Donovan
Re: Time Dependent Intensity (TDI) Corrections
« Reply #53 on: March 22, 2021, 05:22:11 PM »
Hi Andrew,
I'm not sure what you mean by linear-linear.  Do you mean that the y axis is a linear scale and the fit is also linear?  All the TDI equations are based on log intensities (someday I hope you'll see a paper from us on the details of all this!).

Anyway, better to plot these up in the Standard Assignments dialog as you can see multiple data points at a time.

And yes you can weight the initial TDI points using the Analytical | Analysis Options menu dialog as seen here:


The full post discussing this TDI fit feature is here:

https://probesoftware.com/smf/index.php?topic=116.msg461#msg461
« Last Edit: March 23, 2021, 10:18:29 AM by Probeman »
The only stupid question is the one not asked!

Andrew Mott

  • Post Doc
  • ***
  • Posts: 11
Re: Time Dependent Intensity (TDI) Corrections
« Reply #54 on: March 24, 2021, 11:13:28 AM »
Thank you for the tip on weighting the initial TDI points. I've been playing around with that today and seeing some differences.

In the Display Time Dependent Intensity (TDI) and Alternating On/Off Peaks Window you are able to plot 6 different relationships that calculate 6 different TDI intercepts

Linear Intensity - Linear model
Linear Intensity - Quadratic model
Linear Intensity - Log model
Log Intensity - Linear model
Log Intensity - Quadratic model
Log Intensity - Log model

However, we are only able to apply 3 of the models to the analysis. Would it be possible to use the other 3 models as well, since the TDI intercepts are already calculated in the software?

I'm looking at a sample with the following:

Log intensity - Linear model, TDI intercept = 59
Linear intensity - Linear model, TDI intercept = 53

I'm estimating the difference between these two linear models as close to 1 weight percent in this instance.

John Donovan

  • Administrator
  • Emeritus
  • *****
  • Posts: 3268
  • Other duties as assigned...
    • Probe Software
Re: Time Dependent Intensity (TDI) Corrections
« Reply #55 on: March 24, 2021, 11:20:38 AM »
Hi Andrew,
I find it strange that your beam sensitive samples do not exhibit log changes in intensity. As far as I know this has not been previously reported.

It would be significant work to implement three additional models, but I will look into it when I get a chance.

Thinking about it more, you might get a better log fit using a higher beam current.  Also better statistics!
« Last Edit: March 24, 2021, 11:27:29 AM by John Donovan »
John J. Donovan, Pres. 
(541) 343-3400

"Not Absolutely Certain, Yet Reliable"

John Donovan

  • Administrator
  • Emeritus
  • *****
  • Posts: 3268
  • Other duties as assigned...
    • Probe Software
Re: Time Dependent Intensity (TDI) Corrections
« Reply #56 on: March 24, 2021, 01:21:07 PM »
Hi Andrew,
I looked more closely at your plots in the post above and it appears that you are getting slightly better fits using the log intensity plot, though with a very slightly negative curvature.

And also now that I think about it again I have seen such "negative" curvatures for TDI plots, which does indicates that these trends are slightly more linear than a linear log fit.  But again I can't think of a reason why you wouldn't just use the log intensity plots since it is a better fit.
John J. Donovan, Pres. 
(541) 343-3400

"Not Absolutely Certain, Yet Reliable"

Andrew Mott

  • Post Doc
  • ***
  • Posts: 11
Re: Time Dependent Intensity (TDI) Corrections
« Reply #57 on: April 07, 2021, 10:24:52 AM »
One way I've gone about looking at how the models fit is to look at a chart looking at the following (Na counts at elapsed time / maximum Na counts modeled/measured for the point):

At time 0 lets say the model calculates the cps value to be 100 cps/na. At time 10s Na measured was as 80 cps, at time 20s Na measured was 60 cps

In the chart I would plot time 0 as 100% (100/100), at time 10 I would plot 80% (80/100), and at time 20 I would plot 60% (60/100). This allows me to compare how multiple points behave without (*hopefully*) being too influenced by variations in total Na content.

I ran 41 points on my samples (same mineral, just a few different grains)

When I plot the value of Measured/Modeled Na cps/na / Maximum Na cps for a point vs Elapsed time, it looks like the Linear - Linear model does the best job matching how Na behaves during analysis in this mineral. Do you think this is a good way of looking at it?

Thanks again for all of your help with this. It's been a tricky analysis to process.
« Last Edit: April 07, 2021, 10:33:05 AM by Andrew Mott »

John Donovan

  • Administrator
  • Emeritus
  • *****
  • Posts: 3268
  • Other duties as assigned...
    • Probe Software
Re: Time Dependent Intensity (TDI) Corrections
« Reply #58 on: April 07, 2021, 12:00:00 PM »
Hi Andrew,
Interesting stuff.  I'm interested in this mineral, what is it?

But since the TDI fit is applied on a per point basis, I think looking at the statistics for each single point is a better way to evaluate this.
john
John J. Donovan, Pres. 
(541) 343-3400

"Not Absolutely Certain, Yet Reliable"

Andrew Mott

  • Post Doc
  • ***
  • Posts: 11
Re: Time Dependent Intensity (TDI) Corrections
« Reply #59 on: April 07, 2021, 12:41:11 PM »
John,

It's alunite/natroalunite - (K,Na)Al3(SO4)2(OH)6

So you would recommend evaluating the models on a point by point basis rather than trying to be consistent with the model used?

Thanks again.

Andrew