Author Topic: Nasty Boundary Fluorescence Analytical Situations  (Read 54156 times)

Ben Buse

  • Professor
  • ****
  • Posts: 488
Re: Nasty Boundary Fluorescence Analytical Situations
« Reply #30 on: February 22, 2017, 11:22:21 AM »


Hi Ben,
My understanding is that the effect is from additional Fe K shell fluorescence from continuum fluorescence produced in the beam incident sample (Fe), and because there is no Fe in the boundary phase to be fluoresced by the emitted continuum radiation as the boundary is approached. Yes, the same thing will occur for inclusions mounted in epoxy as John Fournelle and Phil Gopon pointed out a few years ago when studying iron silicide inclusions in epoxy.

Note that Fe Kb cannot fluoresce the Fe K shell.

The same thing happens for pure Si, but to a smaller degree:
john


Hi John,

Thanks - had to read that twice - but it makes sense - now I understand it :)! (Of course Fe kb can't fluoresce: its < binding energy)   

Therefore the strength of the effect is the degree to which an element is fluoresced by the continuum.

Thanks

Ben
« Last Edit: February 22, 2017, 11:35:47 AM by Ben Buse »

Probeman

  • Emeritus
  • *****
  • Posts: 2839
  • Never sleeps...
    • John Donovan
Re: Nasty Boundary Fluorescence Analytical Situations
« Reply #31 on: February 22, 2017, 12:15:28 PM »
Hi Ben,
Because of this effect, John Fournelle and Phil Gopon had me add quantification of Ln and Ll lines (La lines are affected by chemical bonding and are not quantitative enough) to Probe for EPMA.

Here is an example for Ln and Ll lines. Note that the boundary effect is *much* smaller for these emission lines.


To allow everyone to perform these calculations themselves (without performing the 10 hour Monte Carlo simulations themselves), I've attached all my PAR files which are calculated below 1 keV. Just extract these to your user data folder Penfluor folder (usually C:\UserData\Penepma12\Penfluor), and you can run these simulations yourself.
john
« Last Edit: April 14, 2020, 11:38:34 AM by John Donovan »
The only stupid question is the one not asked!

Ben Buse

  • Professor
  • ****
  • Posts: 488
Re: Nasty Boundary Fluorescence Analytical Situations
« Reply #32 on: February 22, 2017, 11:12:44 PM »
Yes so you have two options either correct for depleted continuum fluorescence or switch to L lines - which are an important option, good in some situations (use at low kV - have small interaction volume) - but not without their own problems (low intensity, affected by carbon contamination etc.)

Ben

pgopon

  • Professor
  • ****
  • Posts: 26
Re: Nasty Boundary Fluorescence Analytical Situations
« Reply #33 on: February 23, 2017, 02:40:54 AM »
I am reminded of a talk I heard here a few weeks ago from a highly regarded Professor at a California school which shall remain nameless.  There was a particular slide claiming to see differential diffusion profiles towards a grain boundary.  Some quick modeling after the talk showed that it could all be explained by secondary fluorescence.  I know the three Jo/h/n's (Wade, Donovan, and Fournelle) are adamant about trying to educate the public.  What can we do to actually make this point sink in? 

Anyways:  There are essentially two solutions to this problem as Ben mentioned

1) Acquire the data normally and run it through PENEPMA, modeling the influence of secondary fluorescence.  Then removing the influence of secondary fluorescence on each data point during the transect towards the grain boundary.  A bit time consuming right now, but I wonder if PfEPMA wouldn't be able to do that quite easily now that is has the modeling built in..... 

2) Alternatively use the non-traditional lines J.D. mentioned and use low accelerating potential (<8 keV).  The influence of secondary fluorescence goes away for most elements in this case.  You could also use the normal L lines if all you are after is the diffusion profile, and not absolute concentrations.
« Last Edit: February 23, 2017, 09:24:03 AM by John Donovan »

Probeman

  • Emeritus
  • *****
  • Posts: 2839
  • Never sleeps...
    • John Donovan
Re: Nasty Boundary Fluorescence Analytical Situations
« Reply #34 on: February 23, 2017, 09:03:13 AM »
Yes so you have two options either correct for depleted continuum fluorescence or switch to L lines - which are an important option, good in some situations (use at low kV - have small interaction volume) - but not without their own problems (low intensity, affected by carbon contamination etc.)

Hi Ben,
Yes, that's exactly how it looks to me.   The good news is that using Standard.exe, we can at least tell if the secondary fluorescence boundary problem is likely to be negligible, minor or severe.
john
The only stupid question is the one not asked!

John Donovan

  • Administrator
  • Emeritus
  • *****
  • Posts: 3277
  • Other duties as assigned...
    • Probe Software
Re: Nasty Boundary Fluorescence Analytical Situations
« Reply #35 on: February 23, 2017, 09:22:35 AM »
I am reminded of a talk I heard here a few weeks ago from a highly regarded Professor at a California school which shall remain nameless.  There was a particular slide claiming to see differential diffusion profiles towards a grain boundary.  Some quick modeling after the talk showed that it could all be explained by secondary fluorescence.  I know the three Jo/h/n's (Wade, Donovan, and Fournelle) are adamant about trying to educate the public.  What can we do to actually make this point sink in?

Hi Phil,
Yes, it is dismaying to see.  I saw several talks at AGU last December, that claimed to be modeling trace element diffusion, but merely showed secondary fluorescence artifacts.

For now, the best thing is to spread around the link to the secondary fluorescence boundary paper to everyone.  Here is the link again:

http://epmalab.uoregon.edu/publ/Llovet,%20et%20al.,%20Secondary%20fluorescence%20in%20electron%20probe%20microanalysis%20of%20couple%20materials.pdf

The next best thing of course would be for us all to publish some geology papers that actually cite this paper- because apparently geologists don't read the Jour. Appl. Phys!

And just FYI, I am planning on implementing an automatic multi-element secondary fluorescence from boundary correction into Probe for EPMA, but the GUI is non trivial.

And even more important for real world correction of these artifacts is that we will need to calibrate the degree and extent of our Bragg defocusing for each WDS spectrometer/crystal (and probably sin theta) combination as well (the SF boundary modeling/correction in Standard/CalcZAF assumes no WDS Bragg defocusing so it only rigorously applies to EDS spectrometers). This is because the amount of SF artifact from a boundary phase is highly dependent on the relative orientation of the phase boundary to the WDS spectrometer. This is also non-trivial to implement.

I would welcome collaboration on this effort.
john
« Last Edit: February 23, 2017, 01:49:19 PM by John Donovan »
John J. Donovan, Pres. 
(541) 343-3400

"Not Absolutely Certain, Yet Reliable"

John Donovan

  • Administrator
  • Emeritus
  • *****
  • Posts: 3277
  • Other duties as assigned...
    • Probe Software
Re: Nasty Boundary Fluorescence Analytical Situations
« Reply #36 on: March 09, 2017, 05:21:12 PM »
I decided to draw up a couple of simple schematic diagrams to help explain the Bragg defocus effect on secondary fluorescence from boundaries.

Let's take the impressive example of measuring Cr in a basaltic glass adjacent to a chromium phase, for example Cr2O3 or chromite, as seen here:


Because the Fe x-rays emitted from the beam spot in a basaltic glass easily fluoresce the Cr K shell in the adjacent oxide, we get almost 1 wt.% of SF artifact at 1 um from the boundary and even at 100 um from the boundary we still should measure ~100 PPM of Cr in the glass, even if there is no Cr in the glass at all!

Now, there is a strong orientation effect, though *not* for EDS.  With an EDS detector we will see essentially the secondary fluorescence artifact we have modeled  because EDS detectors show no collimation effects for several millimeters or more from the beam position (hence the origin of so-called "system" peaks).

And for WDS spectrometers where the glass to oxide boundary is oriented parallel to the length of the WDS Bragg crystal there is also minimal defocusing effect, therefore what the Standard SF model shows is what one will observe in actual measurements.  This is the situation shown in this schematic:


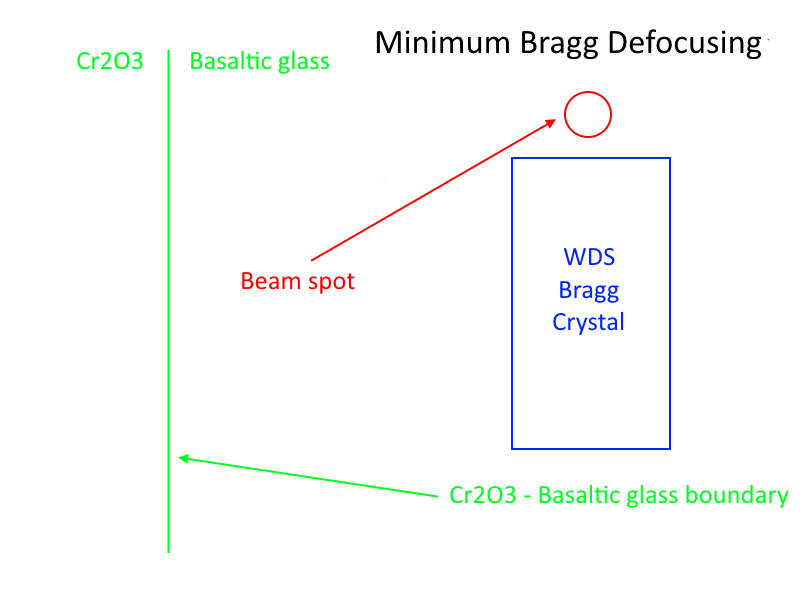
However, if the glass to oxide interface is oriented perpendicular to the length of the WDS Bragg crystal we will have a strong defocusing effect, and the actual secondary fluorescence artifact from the adjacent oxide phase will be decreased depending on the spectrometer geometry details (spectral resolution, sin theta, etc).  This is the situation shown here:


And for "in between" spectrometer to boundary orientations, the degree of Bragg defocusing is also "in-between"!    :o

My next project will be to start devising a procedure to characterize the degree of Bragg defocusing for one's WDS spectrometers, in order to provide a defocus correction to the secondary fluorescence from boundary phases correction in the matrix correction!  A correction of a correction of a correction!

Please let me know if I didn't explain this clearly enough.  It's quite complicated.
john
« Last Edit: April 14, 2020, 11:38:01 AM by John Donovan »
John J. Donovan, Pres. 
(541) 343-3400

"Not Absolutely Certain, Yet Reliable"

Ben Buse

  • Professor
  • ****
  • Posts: 488
Re: Nasty Boundary Fluorescence Analytical Situations
« Reply #37 on: March 13, 2017, 09:13:38 AM »
like this...

« Last Edit: April 14, 2020, 11:37:38 AM by John Donovan »

Probeman

  • Emeritus
  • *****
  • Posts: 2839
  • Never sleeps...
    • John Donovan
Re: Nasty Boundary Fluorescence Analytical Situations
« Reply #38 on: March 13, 2017, 03:48:25 PM »
Very nice Ben!   Much better than my crude schematic!

Just to bring them together a little, here is roughly the orientation of the Bragg crystals for the map defocusing that Ben's image shows:


The red rectangles being the Bragg crystals in the spectrometers (not to scale!). Spectrometers mounted on opposite sides of the instrument will produce this Bragg defocus orientation.
john
« Last Edit: April 14, 2020, 11:37:26 AM by John Donovan »
The only stupid question is the one not asked!

Ben Buse

  • Professor
  • ****
  • Posts: 488
Re: Nasty Boundary Fluorescence Analytical Situations
« Reply #39 on: April 12, 2017, 09:38:25 AM »
Hi,

I was working through the secondary fluorescence ouput - reminding myself what everything is. And something stuck me as odd.

The calc. conc. is the concentration of the component from material A and material B calculated seperately correcting for the matrix effects that each component suffers.

I thought Calc. conc. for B should be: Calc. B Flu Conc. % = Fluor. B Only %. * B ZAF.

As Calc. conc% is the actual matrix effects undergone by the secondary fluorescence x-ray from generation to detection. In the case of Fluor B it will undergo matrix effects in mat. B. Is this right?

But for a case where there is no Al in A it seems to be
Calc. B Flu Conc. % = Fluor. B Only %. * ZAF u/s or A ZAF.

As shown by the following


Measured conc. % is the bulk composition measured by microprobe - so ZAF correction is given by


Thanks

Ben
« Last Edit: April 14, 2020, 11:37:08 AM by John Donovan »

Probeman

  • Emeritus
  • *****
  • Posts: 2839
  • Never sleeps...
    • John Donovan
Re: Nasty Boundary Fluorescence Analytical Situations
« Reply #40 on: April 12, 2017, 10:15:39 AM »
I was working through the secondary fluorescence ouput - reminding myself what everything is. And something stuck me as odd.

The calc. conc. is the concentration of the component from material A and material B calculated seperately correcting for the matrix effects that each component suffers.

I thought Calc. conc. for B should be: Calc. B Flu Conc. % = Fluor. B Only %. * B ZAF.

As Calc. conc% is the actual matrix effects undergone by the secondary fluorescence x-ray from generation to detection. In the case of Fluor B it will undergo matrix effects in mat. B. Is this right?

But for a case where there is no Al in A it seems to be
Calc. B Flu Conc. % = Fluor. B Only %. * ZAF u/s or A ZAF.


Hi Ben,
I love that someone is checking all this.  It's been a long time since I wrote this so I would have to work through it, but since you're already deep into it (and I am swamped with work)...  you can download the entire CalcZAF (and Standard) source code from Github and run through it yourself.  But here is the calculation routine in question for you to see exactly what I am doing:

Code: [Select]
Sub Penepma12OutputKratios(tfolder As String)
' Ouput the original k-ratios and the modified k-ratios, "apparent" concentrations and correction factors
'  analysis.StdAssignsZAFCors(1,chan%) = absorption correction
'  analysis.StdAssignsZAFCors(2,chan%) = fluorescence correction
'  analysis.StdAssignsZAFCors(3,chan%) = atomic number correction
'  analysis.StdAssignsZAFCors(4,chan%) = ZAF correction (abscor*flucor*zedcor)
'  analysis.StdAssignsZAFCors!(5, i%) = stopping power
'  analysis.StdAssignsZAFCors!(6, i%) = backscatter
'  analysis.StdAssignsZAFCors!(7, i%) = std intensity
'  analysis.StdAssignsZAFCors!(8, i%) = unk intensity

ierror = False
On Error GoTo Penepma12OutputKratiosError

Dim i As Integer, j As Integer
Dim ipA As Integer, ipB As Integer, ipBStd As Integer
Dim unk_int_pri As Double, unk_int_flu As Double, unk_int_all As Double
Dim tzafA(1 To MAXZAFCOR%) As Double

Dim unk_krat_meas As Double, unk_zaf_meas As Double, unk_conc_meas As Double

' Initialize module values if case they are not loaded (Mat A does not contain the measured element)
Fanal_Krats! = 0#
Fanal_ZAFCors!(1) = 0#
Fanal_ZAFCors!(2) = 0#
Fanal_ZAFCors!(3) = 0#
Fanal_ZAFCors!(4) = 0#
unk_krat_meas# = 0#
unk_zaf_meas# = 0#
unk_conc_meas# = 0#

' Get composition from each .par file (loads MaterialMeasuredTakeoff# and MaterialMeasuredEnergy# for Penepma12CalculateMatrix)
Call Penepma12GetParFileComposition(Int(3), PENEPMA_Root$ & "\Fanal\db\" & ParameterFileBStd$, PENEPMA_SampleBStd())
If ierror Then Exit Sub
Call Penepma12CalculateMatrix(PENEPMA_Analysis, PENEPMA_SampleBStd(), Penepma_TmpSample())
If ierror Then Exit Sub

' Load BStd parameters for calculations below
For i% = 1 To MAXCHAN%
MatBStd_Krats!(i%) = PENEPMA_Analysis.StdAssignsKfactors!(i%)
MatBStd_StdPercents!(i%) = PENEPMA_Analysis.StdAssignsPercents!(i%)
For j% = 1 To MAXZAFCOR%
MatBStd_ZAFCors!(j%, i%) = PENEPMA_Analysis.StdAssignsZAFCors!(j%, i%)
Next j%
Next i%

' Do material B
Call Penepma12GetParFileComposition(Int(2), PENEPMA_Root$ & "\Fanal\db\" & ParameterFileB$, PENEPMA_SampleB())
If ierror Then Exit Sub
Call Penepma12CalculateMatrix(PENEPMA_Analysis, PENEPMA_SampleB(), Penepma_TmpSample())
If ierror Then Exit Sub

' Load B parameters for calculations below
For i% = 1 To MAXCHAN%
MatB_Krats!(i%) = PENEPMA_Analysis.StdAssignsKfactors!(i%)
MatB_StdPercents!(i%) = PENEPMA_Analysis.StdAssignsPercents!(i%)
For j% = 1 To MAXZAFCOR%
MatB_ZAFCors!(j%, i%) = PENEPMA_Analysis.StdAssignsZAFCors!(j%, i%)
Next j%
Next i%

' Do material A last!!!! (to keep specified element wt%s for non-absorbers in Penepma12OutputKratios3 calculation)
Call Penepma12GetParFileComposition(Int(1), PENEPMA_Root$ & "\Fanal\db\" & ParameterFileA$, PENEPMA_SampleA())
If ierror Then Exit Sub
Call Penepma12CalculateMatrix(PENEPMA_Analysis, PENEPMA_SampleA(), Penepma_TmpSample())
If ierror Then Exit Sub

' Load A parameters for calculations below
For i% = 1 To MAXCHAN%
MatA_Krats!(i%) = PENEPMA_Analysis.StdAssignsKfactors!(i%)
MatA_StdPercents!(i%) = PENEPMA_Analysis.StdAssignsPercents!(i%)

For j% = 1 To MAXZAFCOR%
MatA_ZAFCors!(j%, i%) = PENEPMA_Analysis.StdAssignsZAFCors!(j%, i%)
Next j%
Next i%

' Determine measured element in sample arrays
ipA% = IPOS1%(PENEPMA_SampleA(1).LastChan%, Symlo$(MaterialMeasuredElement%), PENEPMA_SampleA(1).Elsyms$())
ipB% = IPOS1%(PENEPMA_SampleB(1).LastChan%, Symlo$(MaterialMeasuredElement%), PENEPMA_SampleB(1).Elsyms$())
ipBStd% = IPOS1%(PENEPMA_SampleBStd(1).LastChan%, Symlo$(MaterialMeasuredElement%), PENEPMA_SampleBStd(1).Elsyms$())

' Correct intensity data for matrix effects (k-ratio is in %)
If ipA% > 0 And ipBStd% > 0 Then

' First calculate total fluorescence from each material
Call IOWriteLog(vbNullString)
For i% = 1 To nPoints&
If std_int#(i%) = 0# Then GoTo Penepma12OutputKratiosStdIntZero

' Calculate and load total fluorescence and primary k-ratios
fluA_k#(i%) = 100# * (flach#(i%) + flabr#(i%)) / std_int#(i%)
fluB_k#(i%) = 100# * (flbch#(i%) + flbbr#(i%)) / std_int#(i%)
prix_k#(i%) = 100# * pri_int#(i%) / std_int#(i%)
Next i%

' Calculate CalcZAF matrix correction from current ZAF selection (in case it is needed when measured element is not in Mat A)
tzafA#(1) = MatA_ZAFCors!(1, ipA%) / MatBStd_ZAFCors!(1, ipBStd%)    ' 1 = A only, 2 = F only, 3 = Z only, 4 = ZAF
tzafA#(2) = MatA_ZAFCors!(2, ipA%) / MatBStd_ZAFCors!(2, ipBStd%)    ' 1 = A only, 2 = F only, 3 = Z only, 4 = ZAF
tzafA#(3) = MatA_ZAFCors!(3, ipA%) / MatBStd_ZAFCors!(3, ipBStd%)    ' 1 = A only, 2 = F only, 3 = Z only, 4 = ZAF
tzafA#(4) = MatA_ZAFCors!(4, ipA%) / MatBStd_ZAFCors!(4, ipBStd%)    ' 1 = A only, 2 = F only, 3 = Z only, 4 = ZAF

' Calculate Mat A matrix correction based on known intensities and concentrations from Fanal (to be self consistant)
For i% = 1 To nPoints&
unk_int_pri# = pri_int#(i%)                                           ' calculate Mat A primary intensity
unk_int_flu# = flach#(i%) + flabr#(i%)                                ' calculate Mat A fluorescence intensity

' If performing bulk matrix correction, load fluorescence contribution from material B also
If ParameterFileA$ = ParameterFileB$ Then unk_int_flu# = unk_int_flu# + flbch#(i%) + flbbr#(i%)

' Calculate Mat A total intensity (or Mat A and Mat B total intensity if bulk matrix)
unk_int_all# = unk_int_flu# + unk_int_pri#

' Load material A matrix corrections with Fanal values (1 = A only, 2 = F only, 3 = Z only, 4 = ZAF)
If unk_int_all# <> 0# Then
Fanal_Krats! = unk_int_all# / std_int#(i%) * MatBStd_StdPercents!(ipBStd%) / 100#
Fanal_ZAFCors!(4) = MatA_StdPercents!(ipA%) / MatBStd_StdPercents!(ipBStd%) * std_int#(i%) / unk_int_all#

' Overload tzafA ZAF value for self consistent "apparent" concentration calculations below
tzafA#(4) = Fanal_ZAFCors!(4)

' If B std is a pure element and primary intensity is non-zero, then calculate fluorescence and combined ZA terms
If MatBStd_StdPercents!(ipBStd%) = 100# And pri_int#(i%) > 0# Then
Fanal_ZAFCors!(2) = 1# / (1# + unk_int_flu# / unk_int_all#)     ' calculate fluorescence only
'Fanal_ZAFCors!(3) = MatA_StdPercents!(ipA%) / MatBStd_StdPercents!(ipBStd%) * std_int#(i%) / unk_int_pri#
'Fanal_ZAFCors!(1) = MatA_StdPercents!(ipA%) / MatBStd_StdPercents!(ipBStd%) * std_int#(i%) / unk_int_pri#
Fanal_ZAFCors!(3) = Fanal_ZAFCors!(4) / Fanal_ZAFCors!(2)       ' calculate combined ZA
Fanal_ZAFCors!(1) = Fanal_ZAFCors!(4) / Fanal_ZAFCors!(2)       ' calculate combined ZA
End If
End If

' Calculate "measured" concentration using CalcZAF matrix correction based on actual apparent intensities
If MatBStd_StdPercents!(ipBStd%) = 100# Then
Call Penepma12OutputKratios3(ipA%, PENEPMA_Analysis, PENEPMA_SampleA(), yktotal#(i%), unk_krat_meas#, unk_zaf_meas#, unk_conc_meas#)
If ierror Then Exit Sub

' Load "measured" concentration
yktotal_meas#(i%) = unk_krat_meas#
yztotal_meas#(i%) = unk_zaf_meas#
yctotal_meas#(i%) = unk_conc_meas#
nsets& = 4

Else
nsets& = 3
End If

' Apply full material A correction to total intensity to obtain "apparent" concentration in material A
yctotal#(i%) = yktotal#(i%) * tzafA#(4) * MatBStd_StdPercents!(ipBStd%) / 100#

' Apply full material A correction to material A fluorescence to obtain "apparent" concentration from material A fluorescence
ycA_only#(i%) = fluA_k#(i%) * tzafA#(4) * MatBStd_StdPercents!(ipBStd%) / 100#

' Apply full material A correction to material B fluorescence (boundary) to obtain "apparent" concentration from material B fluorescence
ycb_only#(i%) = fluB_k#(i%) * tzafA#(4) * MatBStd_StdPercents!(ipBStd%) / 100#

' Apply full material A correction to primary x-ray to obtain "apparent" concentration
yc_prix#(i%) = prix_k#(i%) * tzafA#(4) * MatBStd_StdPercents!(ipBStd%) / 100#

' Output dist and k-ratio to log window
If ParameterFileA$ <> ParameterFileB$ Then
Call IOWriteLog("Penepma12OutputKratios: dist=" & Format$(xdist(i%)) & " um, kratio%= " & Format$(yktotal(i%)))
Else
If i% = nPoints& Then Call IOWriteLog("Penepma12OutputKratios: matrix kratio%= " & Format$(yktotal(i%)))
End If
Next i%

Else
GoTo Penepma12OutputKratiosElementNotFound
End If

' Create modified k-ratio output file
Call Penepma12OutputKratios2(tfolder$)
If ierror Then Exit Sub

Exit Sub

' Errors
Penepma12OutputKratiosError:
MsgBox Error$, vbOKOnly + vbCritical, "Penepma12OutputKratios"
Close #Temp1FileNumber%
Call IOStatusAuto(vbNullString)
ierror = True
Exit Sub

Penepma12OutputKratiosElementNotFound:
msg$ = "The measured element " & Symlo$(MaterialMeasuredElement%) & " was not found in the material A or the material B Std compositions. This error should not occur, please contact Probe Software with details."
MsgBox msg$, vbOKOnly + vbExclamation, "Penepma12OutputKratio"
Close #Temp1FileNumber%
Call IOStatusAuto(vbNullString)
ierror = True
Exit Sub

Penepma12OutputKratiosStdIntZero:
msg$ = "The standard intensity for the measured element " & Symlo$(MaterialMeasuredElement%) & " " & Xraylo$(MaterialMeasuredXray%) & " was zero for the material B Std composition (" & ParameterFileBStd$ & ") at " & Format$(MaterialMeasuredEnergy#) & " keV. This error should not occur, please contact Probe Software with details (and check the Fanal\k-ratios.dat file)."
MsgBox msg$, vbOKOnly + vbExclamation, "Penepma12OutputKratio"
Close #Temp1FileNumber%
Call IOStatusAuto(vbNullString)
ierror = True
Exit Sub

End Sub

And here is the output code:

Code: [Select]
Sub Penepma12OutputKratios2(tfolder As String)
' Output k-ratio and modified results to a text file for off-line plotting
'  analysis.StdAssignsZAFCors(1,chan%) = absorption correction
'  analysis.StdAssignsZAFCors(2,chan%) = fluorescence correction
'  analysis.StdAssignsZAFCors(3,chan%) = atomic number correction
'  analysis.StdAssignsZAFCors(4,chan%) = ZAF correction (abscor*flucor*zedcor)

ierror = False
On Error GoTo Penepma12OutputKratios2Error

Dim astring As String
Dim i As Integer
Dim ipA As Integer, ipB As Integer, ipBStd As Integer
Dim temp1 As Single, temp2 As Single

 ' Load the modified k-ratio output file name
KRATIOS_DAT_File2$ = tfolder$ & "\k-ratios2.dat"

Open KRATIOS_DAT_File2$ For Output As #Temp1FileNumber%

' Create column labels
astring$ = vbNullString
astring$ = astring$ & VbDquote$ & "TO/keV/Elm/Xray" & VbDquote$ & vbTab
astring$ = astring$ & VbDquote$ & "Distance (um)" & VbDquote$ & vbTab
astring$ = astring$ & VbDquote$ & "Total Inten. %" & VbDquote$ & vbTab
astring$ = astring$ & VbDquote$ & "Fluor. Only %" & VbDquote$ & vbTab

' Calculate and load total fluorescence and primary k-ratios
astring$ = astring$ & VbDquote$ & "Fluor. A Only %" & VbDquote$ & vbTab
astring$ = astring$ & VbDquote$ & "Fluor. B Only %" & VbDquote$ & vbTab
astring$ = astring$ & VbDquote$ & "Pri. Int. Only %" & VbDquote$ & vbTab

astring$ = astring$ & VbDquote$ & "Calc. Total Conc. %" & VbDquote$ & vbTab
astring$ = astring$ & VbDquote$ & "Calc. A Flu Conc. %" & VbDquote$ & vbTab
astring$ = astring$ & VbDquote$ & "Calc. B Flu Conc. %" & VbDquote$ & vbTab
astring$ = astring$ & VbDquote$ & "Calc. Pri. Conc. %" & VbDquote$ & vbTab

astring$ = astring$ & VbDquote$ & "Meas. Total Inten. %" & VbDquote$ & vbTab
astring$ = astring$ & VbDquote$ & "Meas. ZAF" & VbDquote$ & vbTab
astring$ = astring$ & VbDquote$ & "Meas. Total Conc. %" & VbDquote$ & vbTab

astring$ = astring$ & VbDquote$ & "Actual A Conc. %" & VbDquote$ & vbTab
astring$ = astring$ & VbDquote$ & "Actual B Conc. %" & VbDquote$ & vbTab
astring$ = astring$ & VbDquote$ & "Actual B Std Conc. %" & VbDquote$ & vbTab

' Output Fanal matrix factors (unkZAF/stdZAF)
astring$ = astring$ & VbDquote$ & "ZA u/s (Fanal)" & VbDquote$ & vbTab
astring$ = astring$ & VbDquote$ & "Flu u/s (Fanal)" & VbDquote$ & vbTab
astring$ = astring$ & VbDquote$ & "ZAF u/s (Fanal)" & VbDquote$ & vbTab

' Output related CalcZAF factors
astring$ = astring$ & VbDquote$ & "ZA u/s (CalcZAF)" & VbDquote$ & vbTab
astring$ = astring$ & VbDquote$ & "Flu u/s (CalcZAF)" & VbDquote$ & vbTab
astring$ = astring$ & VbDquote$ & "ZAF u/s (CalcZAF)" & VbDquote$ & vbTab

' Output normal CalcZAF matrix factors
astring$ = astring$ & VbDquote$ & "A Abs (CalcZAF)" & VbDquote$ & vbTab
astring$ = astring$ & VbDquote$ & "A Flu (CalcZAF)" & VbDquote$ & vbTab
astring$ = astring$ & VbDquote$ & "A Zed (CalcZAF)" & VbDquote$ & vbTab
astring$ = astring$ & VbDquote$ & "A ZAF (CalcZAF)" & VbDquote$ & vbTab

astring$ = astring$ & VbDquote$ & "B Abs (CalcZAF)" & VbDquote$ & vbTab
astring$ = astring$ & VbDquote$ & "B Flu (CalcZAF)" & VbDquote$ & vbTab
astring$ = astring$ & VbDquote$ & "B Zed (CalcZAF)" & VbDquote$ & vbTab
astring$ = astring$ & VbDquote$ & "B ZAF (CalcZAF)" & VbDquote$ & vbTab

astring$ = astring$ & VbDquote$ & "B Std Abs (CalcZAF)" & VbDquote$ & vbTab
astring$ = astring$ & VbDquote$ & "B Std Flu (CalcZAF)" & VbDquote$ & vbTab
astring$ = astring$ & VbDquote$ & "B Std Zed (CalcZAF)" & VbDquote$ & vbTab
astring$ = astring$ & VbDquote$ & "B Std ZAF (CalcZAF)" & VbDquote$ & vbTab

astring$ = astring$ & VbDquote$ & "Distance (ug/cm2)" & VbDquote$ & vbTab
Print #Temp1FileNumber%, astring$

' Determine measured element in sample arrays (only ipB can be zero)
ipA% = IPOS1%(PENEPMA_SampleA(1).LastChan%, Symlo$(MaterialMeasuredElement%), PENEPMA_SampleA(1).Elsyms$())
ipB% = IPOS1%(PENEPMA_SampleB(1).LastChan%, Symlo$(MaterialMeasuredElement%), PENEPMA_SampleB(1).Elsyms$())
ipBStd% = IPOS1%(PENEPMA_SampleBStd(1).LastChan%, Symlo$(MaterialMeasuredElement%), PENEPMA_SampleBStd(1).Elsyms$())
If ipA% = 0 Or ipBStd% = 0 Then GoTo Penepma12OutputKratios2NoEmittingElement

' Check for number of points
If nPoints& < 1 Then GoTo Penepma12OutputKratios2NoPoints

' Output data
For i% = 1 To nPoints&
astring$ = vbNullString
astring$ = astring$ & VbDquote$ & Format$(MaterialMeasuredTakeoff#) & "/" & Format$(MaterialMeasuredEnergy#) & "/" & Trim$(Symup$(MaterialMeasuredElement%)) & "/" & Xraylo$(MaterialMeasuredXray%) & VbDquote$ & vbTab
astring$ = astring$ & MiscAutoFormatD$(xdist#(i%)) & vbTab
astring$ = astring$ & MiscAutoFormatD$(yktotal#(i%)) & vbTab
astring$ = astring$ & MiscAutoFormatD$(ykfluor#(i%)) & vbTab

astring$ = astring$ & MiscAutoFormatD$(fluA_k#(i%)) & vbTab
astring$ = astring$ & MiscAutoFormatD$(fluB_k#(i%)) & vbTab
astring$ = astring$ & MiscAutoFormatD$(prix_k#(i%)) & vbTab

astring$ = astring$ & MiscAutoFormatD$(yctotal#(i%)) & vbTab
astring$ = astring$ & MiscAutoFormatD$(ycA_only#(i%)) & vbTab
astring$ = astring$ & MiscAutoFormatD$(ycb_only#(i%)) & vbTab
astring$ = astring$ & MiscAutoFormatD$(yc_prix#(i%)) & vbTab

astring$ = astring$ & MiscAutoFormatD$(yktotal_meas#(i%)) & vbTab
astring$ = astring$ & MiscAutoFormatD$(yztotal_meas#(i%)) & vbTab
astring$ = astring$ & MiscAutoFormatD$(yctotal_meas#(i%)) & vbTab

' Only output material B concentration if measured element is present in material B
astring$ = astring$ & MiscAutoFormat$(MatA_StdPercents!(ipA%)) & vbTab
If ipB% > 0 Then
astring$ = astring$ & MiscAutoFormat$(MatB_StdPercents!(ipB%)) & vbTab
Else
astring$ = astring$ & MiscAutoFormat$(INT_ZERO%) & vbTab
End If
astring$ = astring$ & MiscAutoFormat$(MatBStd_StdPercents!(ipBStd%)) & vbTab

' Output Fanal matrix factors (unkZAF/stdZAF)
astring$ = astring$ & MiscAutoFormat$(Fanal_ZAFCors!(1)) & vbTab     ' combined ZA terms
astring$ = astring$ & MiscAutoFormat$(Fanal_ZAFCors!(2)) & vbTab     ' fluorescence only
astring$ = astring$ & MiscAutoFormat$(Fanal_ZAFCors!(4)) & vbTab     ' ZAF correction

' Output related CalcZAF matrix factors (unkZAF/stdZAF)
temp1! = MatA_ZAFCors!(1, ipA%) * MatA_ZAFCors!(3, ipA%)
temp2! = MatBStd_ZAFCors!(1, ipBStd%) * MatBStd_ZAFCors!(3, ipBStd%)
astring$ = astring$ & MiscAutoFormat$(temp1! / temp2!) & vbTab                                        ' combined ZA term
astring$ = astring$ & MiscAutoFormat$(MatA_ZAFCors!(2, ipA%) / MatBStd_ZAFCors!(2, ipBStd%)) & vbTab  ' fluorescence only
astring$ = astring$ & MiscAutoFormat$(MatA_ZAFCors!(4, ipA%) / MatBStd_ZAFCors!(4, ipBStd%)) & vbTab  ' ZAF correction

' Output CalcZAF matrix factors
astring$ = astring$ & MiscAutoFormat$(MatA_ZAFCors!(1, ipA%)) & vbTab    ' absorption
astring$ = astring$ & MiscAutoFormat$(MatA_ZAFCors!(2, ipA%)) & vbTab    ' fluorescence
astring$ = astring$ & MiscAutoFormat$(MatA_ZAFCors!(3, ipA%)) & vbTab    ' atomic number
astring$ = astring$ & MiscAutoFormat$(MatA_ZAFCors!(4, ipA%)) & vbTab    ' ZAF correction

' Only output material B matrix corrections if measured element is present in material B
If ipB% > 0 Then
astring$ = astring$ & MiscAutoFormat$(MatB_ZAFCors!(1, ipB%)) & vbTab    ' absorption
astring$ = astring$ & MiscAutoFormat$(MatB_ZAFCors!(2, ipB%)) & vbTab    ' fluorescence
astring$ = astring$ & MiscAutoFormat$(MatB_ZAFCors!(3, ipB%)) & vbTab    ' atomic number
astring$ = astring$ & MiscAutoFormat$(MatB_ZAFCors!(4, ipB%)) & vbTab    ' ZAF correction
Else
astring$ = astring$ & MiscAutoFormat$(INT_ZERO%) & vbTab
End If

astring$ = astring$ & MiscAutoFormat$(MatBStd_ZAFCors!(1, ipBStd%)) & vbTab    ' absorption
astring$ = astring$ & MiscAutoFormat$(MatBStd_ZAFCors!(2, ipBStd%)) & vbTab    ' fluorescence
astring$ = astring$ & MiscAutoFormat$(MatBStd_ZAFCors!(3, ipBStd%)) & vbTab    ' atomic number
astring$ = astring$ & MiscAutoFormat$(MatBStd_ZAFCors!(4, ipBStd%)) & vbTab    ' ZAF correction

' Calculate mass distance (thickness in ug/cm2)
mdist#(i%) = PENEPMA_SampleA(1).SampleDensity! * Abs(xdist#(i%)) * CMPERMICRON# * MICROGRAMSPERGRAM&
astring$ = astring$ & MiscAutoFormatD$(mdist#(i%)) & vbTab

Print #Temp1FileNumber%, astring$
Next i%

Close #Temp1FileNumber%

' Confirm with user
msg$ = "Modified K-ratio file " & MiscGetFileNameOnly$(KRATIOS_DAT_File2$) & " was saved to " & tfolder$
Call IOWriteLog(msg$)

' Calculate hemispheric intensities for all radii
ReDim yhemi(1 To nPoints&) As Single
Call Penepma12CalculateHemisphere(nPoints&, xdist#(), ykfluor#(), yhemi!())
If ierror Then Exit Sub

Exit Sub

' Errors
Penepma12OutputKratios2Error:
MsgBox Error$, vbOKOnly + vbCritical, "Penepma12OutputKratios2"
Close #Temp1FileNumber%
Call IOStatusAuto(vbNullString)
ierror = True
Exit Sub

Penepma12OutputKratios2NoEmittingElement:
msg$ = "The emitting element is not in paramter A or in parameter BStd (this error should not occur)"
MsgBox msg$, vbOKOnly + vbExclamation, "Penepma12OutputKratios2"
Close #Temp1FileNumber%
Call IOStatusAuto(vbNullString)
ierror = True
Exit Sub

Penepma12OutputKratios2NoPoints:
msg$ = "The number of intensity points output is less than one so something went wrong with the Fanal calculation (try typing Fanal < Fanal.in from the Fanal prompt and see what happens)"
MsgBox msg$, vbOKOnly + vbExclamation, "Penepma12OutputKratios2"
Close #Temp1FileNumber%
Call IOStatusAuto(vbNullString)
ierror = True
Exit Sub

End Sub

And here is the "apparent" concentration calculation code:

Code: [Select]
Sub Penepma12OutputKratios3(ipA As Integer, analysis As TypeAnalysis, sample() As TypeSample, kratio#, unk_krat_meas#, unk_zaf_meas#, unk_conc_meas#)
' Perform an iteration to calculate the "apparent" concentration (B Std must be a pure element)

ierror = False
On Error GoTo Penepma12OutputKratios3Error

Dim i As Integer
Dim zerror As Integer
Dim unk_krats(1 To MAXCHAN%) As Single

' Load all elements as elemental k-ratios
For i% = 1 To sample(1).LastChan%
unk_krats!(i%) = MatA_Krats!(i%)
If i% = ipA% Then unk_krats!(i%) = kratio# / 100#    ' load calculated (measured) k-ratio
Next i%

' Reload the element arrays based on the unknown sample setup
Call ElementGetData(sample())
If ierror Then Exit Sub

' Initialize calculations (0 = phi/rho/z, 1,2,3,4 = alpha fits, 5 = calilbration curve, 6 = fundamental parameters)
If CorrectionFlag% <> MAXCORRECTION% Then
Call ZAFSetZAF(sample())
If ierror Then Exit Sub
Else
'Call ZAFSetZAF3(sample())
'If ierror Then Exit Sub
End If

' No assigned standard used in k-ratio calculation
For i% = 1 To sample(1).LastElm%
sample(1).StdAssigns%(i%) = MAXINTEGER%     ' fake standard assignment
Next i%

' Init intensities for unknown and standard
For i% = 1 To sample(1).LastChan%
analysis.StdAssignsCounts!(i%) = 1#
analysis.StdAssignsKfactors!(i%) = 1#
analysis.StdAssignsPercents!(i%) = 100#
Next i%

' Calculate ZAF weights
Call ZAFSmp(Int(1), unk_krats!(), zerror%, analysis, sample())
If ierror Then Exit Sub

' Return k-ratios and concentrations
unk_krat_meas# = analysis.UnkKrats!(ipA%) * 100#
unk_zaf_meas# = analysis.UnkZAFCors!(4, ipA%)
unk_conc_meas# = analysis.WtPercents!(ipA%)

Exit Sub

' Errors
Penepma12OutputKratios3Error:
MsgBox Error$, vbOKOnly + vbCritical, "Penepma12OutputKratios3"
ierror = True
Exit Sub

End Sub

Please let me know where you think I'm doing it wrong.
john
« Last Edit: April 12, 2017, 10:18:49 AM by Probeman »
The only stupid question is the one not asked!

Ben Buse

  • Professor
  • ****
  • Posts: 488
Re: Nasty Boundary Fluorescence Analytical Situations
« Reply #41 on: April 12, 2017, 10:59:51 AM »
Thanks John - that's good to have the code - and see what it's doing

I may be barking up the wrong tree - For I also looked at Fe secondary fluorescence in Anorthite (grass valley), which also contains Fe. And I couldn't figure out why calc. B conc./fluor. B conc. didn't equal ZAF (see below). So its good to see the code


and


Ben
« Last Edit: April 13, 2020, 10:37:48 PM by John Donovan »

jon_wade

  • Professor
  • ****
  • Posts: 82
Re: Nasty Boundary Fluorescence Analytical Situations
« Reply #42 on: November 15, 2017, 02:37:25 AM »
Its not the best - too many words, but John, here it is.  I may one day get around to writing this up.  One day.....


Probeman

  • Emeritus
  • *****
  • Posts: 2839
  • Never sleeps...
    • John Donovan
Re: Nasty Boundary Fluorescence Analytical Situations
« Reply #43 on: November 15, 2017, 10:02:31 AM »
Its not the best - too many words, but John, here it is.  I may one day get around to writing this up.  One day.....

Hi Jon,
You really should write this up soon!  People need to know about this.
john
The only stupid question is the one not asked!

Probeman

  • Emeritus
  • *****
  • Posts: 2839
  • Never sleeps...
    • John Donovan
Re: Nasty Boundary Fluorescence Analytical Situations
« Reply #44 on: November 21, 2017, 11:38:58 AM »
I was trying to find Julie Chouinard's poster from 2014 M&M on secondary fluorescence effects for melt inclusions and couldn't locate it, so here it is attached below (please login to see attachments).
john
« Last Edit: November 21, 2017, 11:40:36 AM by Probeman »
The only stupid question is the one not asked!