Hi Les,
Ok, the C-S binary run in Penepma finished the first composition which just happens to be one of your compositions, that is, 1 percent sulfur in carbon (skill not luck!).

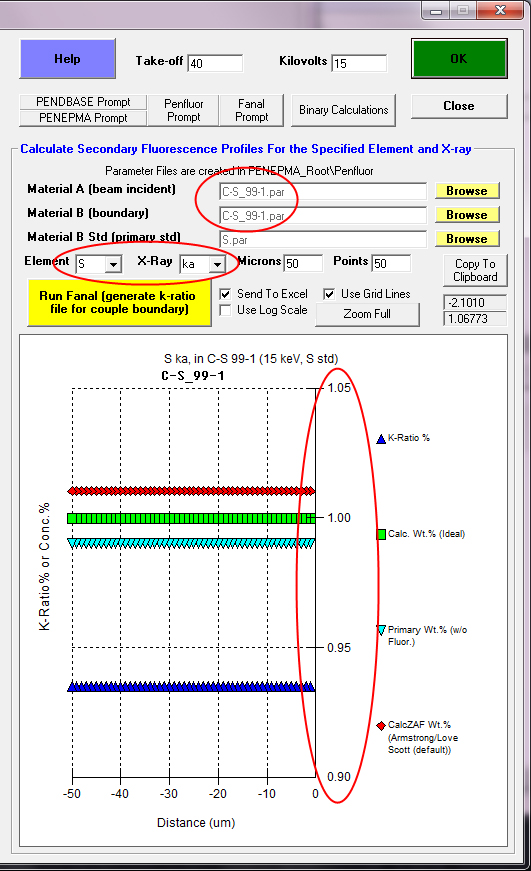
If I read your questions correctly, as you can see, both CalcZAF and Penepma agree closely (the red and green symbols), the matrix corrections are a relative non-issue (CalcZAF = 1.08, Penepma = 1.07) at 15 keV. I attach a detailed Excel output for the calculation below.
Now at 5 keV, the situation is...
what just a darn tootin' minute! This is interesting: the matrix correction for 1% S in C is quite a bit larger at 5 keV than 15 keV, quite unintuitive! See here:
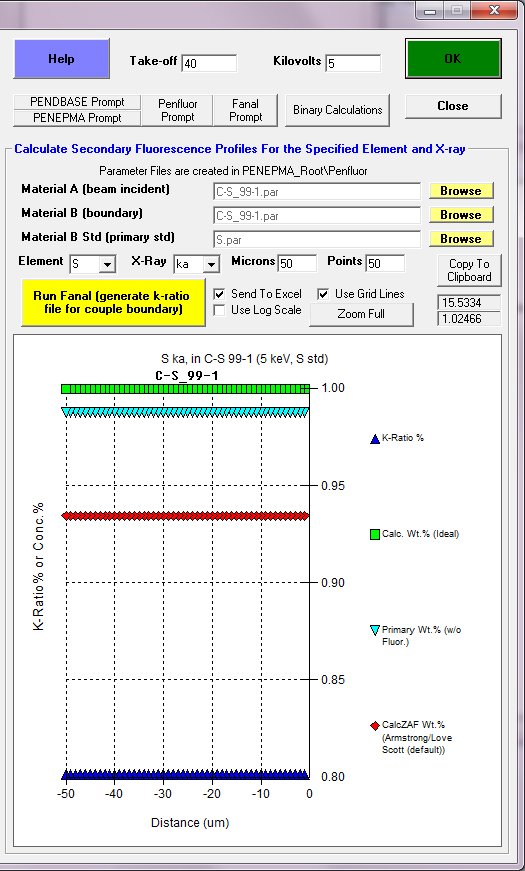
I attach the 5 keV Excel sheet below also. I have to admit, this is surprising. If we just look at CalcZAF here are the 15 keV data:
ELEMENT ABSCOR FLUCOR ZEDCOR ZAFCOR STP-POW BKS-COR F(x)u Ec Eo/Ec MACs
S ka .9851 1.0000 1.0968 1.0805 1.1746 .9338 .9451 2.4720 6.0680 197.942
C ka 1.1108 1.0000 .9990 1.1096 .9984 1.0006 .4653 .2838 52.8467 2791.77
ELEMENT K-RAW K-VALUE ELEMWT% OXIDWT% ATOMIC% FORMULA KILOVOL
S ka .00000 .00925 1.000 ----- .377 .004 15.00
C ka .00000 .89219 99.000 ----- 99.623 .996 15.00
TOTAL: 100.000 ----- 100.000 1.000
And here is the same composition at 5 keV:
ELEMENT ABSCOR FLUCOR ZEDCOR ZAFCOR STP-POW BKS-COR F(x)u Ec Eo/Ec MACs
S ka .9979 1.0000 1.1684 1.1659 1.2104 .9653 .9931 2.4720 2.0227 197.942
C ka 1.0222 1.0000 .9986 1.0208 .9980 1.0006 .8693 .2838 17.6156 2791.77
ELEMENT K-RAW K-VALUE ELEMWT% OXIDWT% ATOMIC% FORMULA KILOVOL
S ka .00000 .00858 1.000 ----- .377 .004 5.00
C ka .00000 .96980 99.000 ----- 99.623 .996 5.00
TOTAL: 100.000 ----- 100.000 1.000
The matrix correction for S Ka in carbon is twice as large at 5 keV than 15 keV. As you are probably aware, usually the lower the beam energy the smaller the matrix correction since the average emitted x-ray absorption path length is shorter at lower beam energies. For example, here is 1% Si in Al at 15 keV:
ELEMENT ABSCOR FLUCOR ZEDCOR ZAFCOR STP-POW BKS-COR F(x)u Ec Eo/Ec MACs
Si ka 1.9811 1.0000 .9738 1.9291 .9811 .9925 .4571 1.8390 8.1566 3184.61
Al ka 1.0004 .9997 1.0003 1.0003 1.0002 1.0001 .8870 1.5600 9.6154 403.602
ELEMENT K-RAW K-VALUE ELEMWT% OXIDWT% ATOMIC% FORMULA KILOVOL
Si ka .00000 .00518 1.000 ----- .961 .010 15.00
Al ka .00000 .98971 99.000 ----- 99.039 .990 15.00
TOTAL: 100.000 ----- 100.000 1.000
Note the large matrix correction for Si Ka. And now at 5 keV, the Si Ka matrix correction is almost half as seen here:
ELEMENT ABSCOR FLUCOR ZEDCOR ZAFCOR STP-POW BKS-COR F(x)u Ec Eo/Ec MACs
Si ka 1.1170 1.0000 .9786 1.0931 .9837 .9948 .8832 1.8390 2.7189 3184.61
Al ka 1.0001 .9998 1.0002 1.0001 1.0002 1.0001 .9832 1.5600 3.2051 403.602
ELEMENT K-RAW K-VALUE ELEMWT% OXIDWT% ATOMIC% FORMULA KILOVOL
Si ka .00000 .00915 1.000 ----- .961 .010 5.00
Al ka .00000 .98993 99.000 ----- 99.039 .990 5.00
TOTAL: 100.000 ----- 100.000 1.000
Very interesting- I did not see that coming!
On the other hand what about time dependent intensity effects (TDI), such as losing sulfur during the acquisition? I've never tried analyzing sulfur in graphite, so I have no idea...


 If you can't see some "in-line" images in a post, try "refreshing" your browser!