Normally one should utilize a robust software application such as STRATAGem for characterization of thin film samples. Using STRATAGem for thin film analysis with Probe for EPMA is easy and is documented here:
http://probesoftware.com/smf/index.php?topic=111.0But STRATAGem is not cheap and if one doesn't have the money, one can if necessary, utilize CalcZAF for characterization of thin film samples. The advantage of STRATAGem is that is can utilize multiple keV measurements and also correct for fluorescence between the thin film and the substrate, whereas CalcZAF calculates one keV at a time and assumes no substrate.
Therefore CalcZAF should not be used in cases where the substrate characteristic emissions can fluoresce the k-shell of an element in the thin film. Of course there is also continuum fluorescence, but if the substrate is a low Z element such as Si, the worst fluorescence effects will be limited to situations where there is phosphorous in the thin film on a Si substrate.
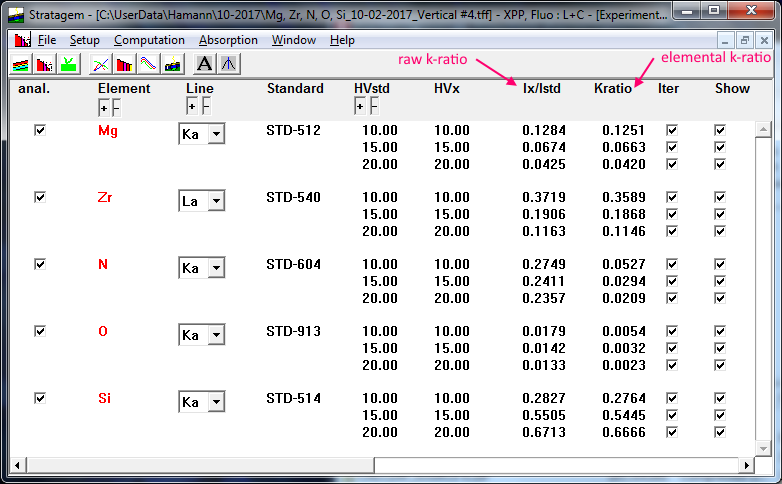
But first let's review a thin film sample using STRATAGem to see how good we should be able to do, and then we'll see how close CalcZAF gets without including substrate effects. First we load the raw k-ratios into STRATAGem (using a file exported from Probe for EPMA which includes the raw k-ratios, standard compositions and sample geometry) as seen here:
When we click the Iterate menu in STRATAGem the program calculates a model based on all the raw k-ratios at all the beam energies utilized as seen here:

The results are output here (the iteration windows shows a 99.8% un-normalized sum) for normalized concentrations and atom fractions:

So this is what we are aiming for. Note the standard compositions are listed here (from the default standard database that comes with CalcZAF):
St 512 Magnesium metal
ELEM: Mg O SUM
ELWT: 99.900 .100 100.000
St 540 Zirconium metal
ELEM: Zr O SUM
ELWT: 99.500 .500 100.000
St 604 Boron Nitride (BN)
ELEM: N B O C SUM
ELWT: 53.300 41.100 2.300 3.600 100.300
St 913 Al2O3 (elemental) (#13)
ELEM: Al O SUM
ELWT: 52.920 47.080 100.000
St 514 Silicon metal
ELEM: Si SUM
ELWT: 100.000 100.000
Now let's run CalcZAF and enter our raw k-ratios as seen here, starting with the 10 keV measurements (one could alternatively enter intensities for both the unknowns and standards):
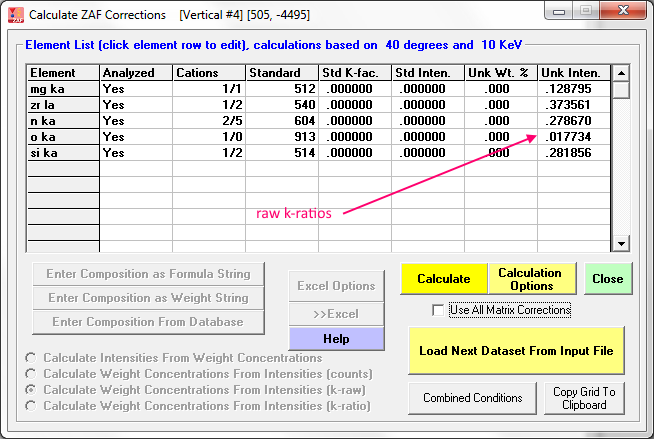
First note that the Calculate Weight Concentrations From Intensities option is selected (though grayed out since an import file was utilized). If you enter raw k-ratios by hand you will want to be sure to select this option before clicking the Calculate button.
By the way, these raw k-ratios are also already corrected for spectral interferences when output by PFE (and of course corrected for background, deadtime, and standard intensity drift), and can be imported into CalcZAF using the CalcZAF input file format or by simply clicking an empty element row and typing the values in. If we now click the Calculate button in CalcZAF we get this result:

and in the log window this result:
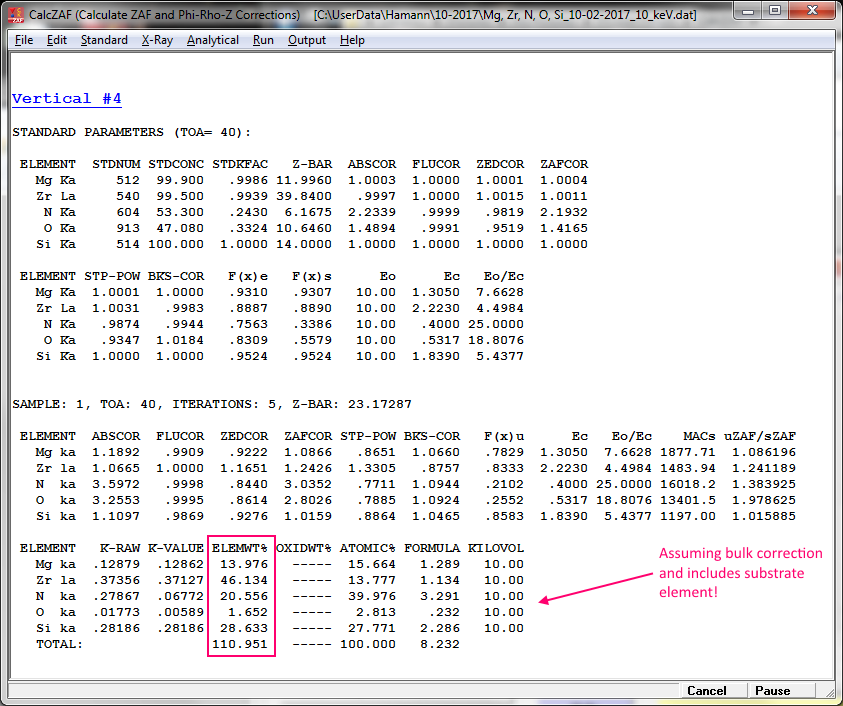
which is obviously incorrect since we've included the Si intensities from the substrate and also we're assuming a bulk geometry still. So first we delete the Si intensity as seen here:

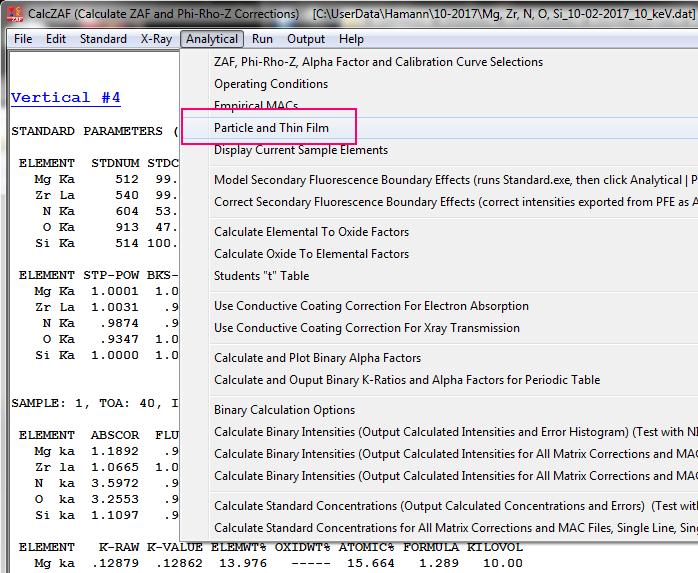
and then we specify our thin film geometry from this menu here in CalcZAF:
Once in the particle and thin film dialog we specify the following (we entered 5 for the density just to be consistent with STRATAGem):
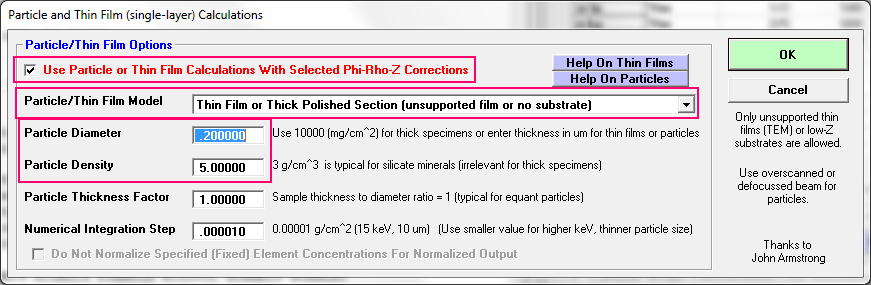
We entered .2 um (200 nm) just as a guess at the thin film thickness and this is what we get for the calculation now:

The total is a little high which means we are under estimating the thickness, but the composition is not looking too awful. Changing the thickness to 0.23 um (230 nm), we obtain this calculation result:

Which looks pretty good, though it could be improved by increasing the thickness slightly, though we may also want to decrease the Numerical Integration Step by a factor of 10 or so for best accuracy.
Now this is only the 10 keV data, there is still the 15 kV and 20 keV data which I will leave to you, gentle reader. The data files are attached below (remember to login to see attachments).
CalcZAF wasn't designed for substrate-thin film corrections but it comes pretty close, and it's free, so worth trying if you don't have STRATAGem already in your lab.
And please, let me know if you have further questions.
john


 To protect your privacy, you must first log in before you can view forum statistics and user profiles