Author Topic: New method for calibration of dead times (and picoammeter)  (Read 23139 times)

John Donovan

  • Administrator
  • Emeritus
  • *****
  • Posts: 3267
  • Other duties as assigned...
    • Probe Software
Re: New method for calibration of dead times (and picoammeter)
« Reply #165 on: February 10, 2023, 10:23:59 AM »
In case anyone is curious about the PHA tuning adjustments for the above high speed maps I'll remind everyone that when utilizing a large range of count rates we should keep in mind the pulse height depression which occurs at high count rates.

This pulse height depression effect causes the PHA peak to shift towards lower voltages at higher count rates, thus increasing the possibility of some counts being cut off by the baseline level at these higher count rates. The solution is to always tune ones PHA settings at the highest expected count rate (highest beam current on a material with the highest expected concentration- usually one's primary standard).

In the above high speed mapping example we utilized SiO2 as the primary standard for Si Ka, therefore we should tune our PHA settings on that material at the highest expected beam current. However, since we intend to acquire our olivine unknowns at 200 nA and our primary standards at only 30 nA, and since the concentration of Si in SiO2 is about 50% and the concentration of Si in olivines is about 20% (in round numbers), we could compare these concentrations and beam currents by considering that our olivines have 2.5 times less Si than our primary standard, but will be measured at 6.6 times the beam current, so we should probably tune our Si Ka PHA on the olivine unknown at 200 nA for the highest expected count rate (of course the exact count rate depends on the absorption correction differences between these materials also, but we're just speaking in round numbers here).

But to make things more interesting I decided to tune the PHA settings on the primary standards at 200 nA. Here is Si Ka on SiO2 at 200 nA:


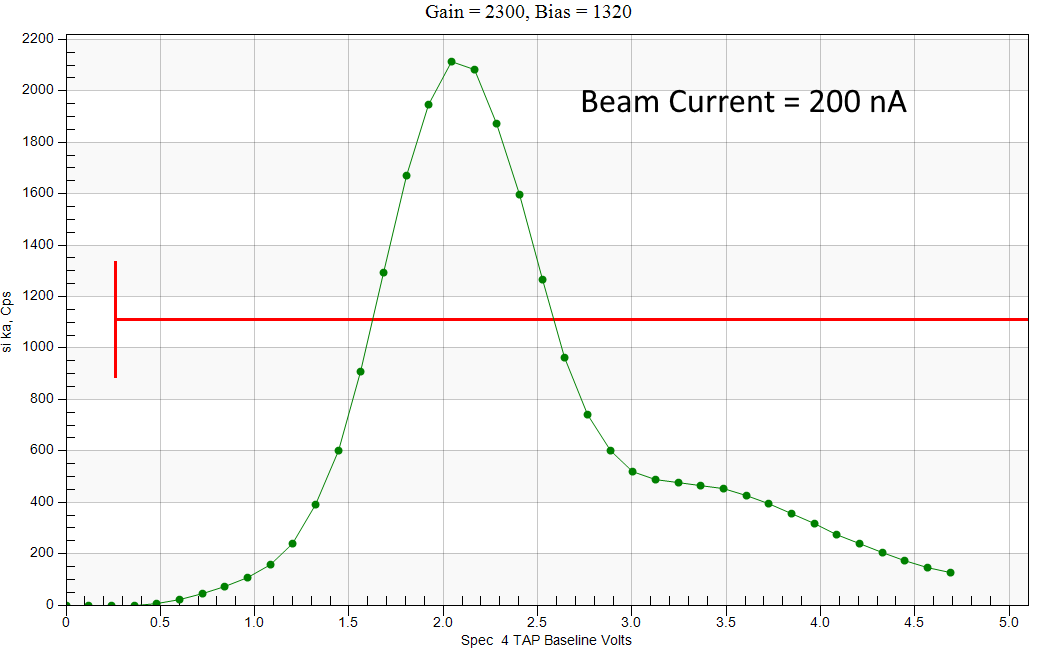
Note that the gain was adjusted to place the PHA peak fully above the baseline level even at this quite high count rate (~160 kcps). And remember, although the PHA peak appears to be slightly cut off at the right side of the plot, that is merely an artifacts of the PHA display system. All counts to the right of the plot axis are fully counted because we are in INTEGRAL mode.

Next here is the Si Ka PHA scan again on SiO2 at the same PHA settings but using a beam current of 30 nA:


We can see that the PHA peak has shifted even further to the right, but again we don't care as all pulse to the right of the plot will all be counted in INTEGRAL mode.

Remember, on Cameca instruments we will be adjusting the gain to place the PHA peak above the baseline at the highest expected count rate, while on JEOL instruments, we will be adjusting the bias the place the PHA peak above the baseline level at the highest expected count rate.
John J. Donovan, Pres. 
(541) 343-3400

"Not Absolutely Certain, Yet Reliable"

Ben Buse

  • Professor
  • ****
  • Posts: 488
Re: Constant k-ratio method for dead time calibration
« Reply #166 on: April 04, 2023, 03:14:22 AM »
Hi all, since my instrument (JEOL 8530F) is ~10years old and i had some extra time to play with new features, I decided to use Startwin to automate deadtime measurements.

Using Paul's xls sheet, two deadtimes are given, one fitting all of the data (DT us All) and one fitting only the higher beam currents (DT Last)-- do you have a rule of thumb as to which I should input into the scalars.dat file?

I updated my scalars.dat file in line ~77, so that should override the parameters specified in Line 13 correct?

Here are my values (micro-sec) for comparison over time:
Initial DT (Kremser, 2013)           2023 Values (full-fit, Si Ka on TAP/PETJ)
Sp1   1.72                                  1.85
Sp2   1.49                                  1.25
Sp3   1.70                                  1.43
Sp4   1.65                                  1.42
Sp5   1.68                                  1.70

Do these changes make sense?

The values don't seem too unreasonable though some are maybe a little high, but the instrument is pretty old. Have you ever had any detectors replaced?  The Xenon detectors can age particularly fast and should be replaced about every 5 years or so.

But I quickly want to point out that this dead time calibration method is now considered obsolete as it is only good to around 50 kcps. Instead you should be utilizing the much discussed "constant k-ratio" method (combined with the new logarithmic dead time expression), which allows one to perform quantitative analyses at count rates up to 300 or 400 kcps. More information on the "constant k-ratio" can be found in this topic and you might want to start with this post here, though the entire topic is worth a read:

https://probesoftware.com/smf/index.php?topic=1466.msg11416#msg11416

In fact, if you have a fairly recent version of Probe for EPMA, the step by step directions for this "constant k-ratio" method are provided as a pdf from the Help menu, but I've also attached the pdf to this post as well.

Please be sure to ask if you have any questions at all.

Hi John,

Just tried your constant k-ratio deadtime measurement as described in the pdf, it's real nice being able to modify deadtime and see affect on raw kratio x-y scatter plot, - I was conservative and stopped short of when pha peak width became enormous. On XY plot is raw counts - counts per sec?

Thanks

« Last Edit: April 04, 2023, 03:20:52 AM by Ben Buse »

John Donovan

  • Administrator
  • Emeritus
  • *****
  • Posts: 3267
  • Other duties as assigned...
    • Probe Software
Re: Constant k-ratio method for dead time calibration
« Reply #167 on: April 04, 2023, 07:59:32 AM »
Hi John,

Just tried your constant k-ratio deadtime measurement as described in the pdf, it's real nice being able to modify deadtime and see affect on raw kratio x-y scatter plot, - I was conservative and stopped short of when pha peak width became enormous. On XY plot is raw counts - counts per sec?

Thanks

Well it depends on what you choose for your plot axes. I usually plot k-ratio on the Y axes and beam current on the X axis.  But you can also plot raw counts on the X axis as shown in this post here:

https://probesoftware.com/smf/index.php?topic=1466.msg11248;topicseen#msg11248

and yes, those would be in raw cps (uncorrected for dead time).  But remember, those raw counts in the Output Standard and Unknown XY Plots menu, will be for the samples selected, so that will be the unknown or secondary standard raw counts (not the primary standard).  Which is why I re-plotted the data in Grapher after exporting.  So I could have the secondary standard k-ratios on the Y axis and the primary standard raw counts on the x-axis.

The constant k-ratio is a pretty cool method isn't it? You should share some k-ratio data with us...  how high did you go in count rate on your primary standard?
« Last Edit: April 05, 2023, 07:37:30 AM by John Donovan »
John J. Donovan, Pres. 
(541) 343-3400

"Not Absolutely Certain, Yet Reliable"

Probeman

  • Emeritus
  • *****
  • Posts: 2830
  • Never sleeps...
    • John Donovan
Re: New method for calibration of dead times (and picoammeter)
« Reply #168 on: April 19, 2023, 01:11:51 PM »
This post here:

https://probesoftware.com/smf/index.php?topic=340.msg11795#msg11795

has absolutely nothing to do with the constant k-ratio method for dead time and picoammeter calibration, but it does nicely illustrate why plotting deviations (or k-ratios!) on a horizontal axis improves ones ability to see small artifacts in the data...
The only stupid question is the one not asked!

Probeman

  • Emeritus
  • *****
  • Posts: 2830
  • Never sleeps...
    • John Donovan
Re: Constant k-ratio method for dead time calibration
« Reply #169 on: April 19, 2023, 01:14:22 PM »
...I was conservative and stopped short of when pha peak width became enormous.

Remember, as long as you are in integral PHA mode and your PHA peak (and escape peak if present), are above the baseline level, it doesn't matter how wide your PHA peak is!

All the photons will get counted in integral mode.
The only stupid question is the one not asked!

Probeman

  • Emeritus
  • *****
  • Posts: 2830
  • Never sleeps...
    • John Donovan
Re: New method for calibration of dead times (and picoammeter)
« Reply #170 on: May 17, 2023, 09:26:51 AM »
We are pleased to announce the publication of our new paper on improving dead time corrections in WDS EPMA:

John J Donovan and others, A New Method for Dead Time Calibration and a New Expression for Correction of WDS Intensities for Microanalysis, Microscopy and Microanalysis, 2023

https://academic.oup.com/mam/advance-article-abstract/doi/10.1093/micmic/ozad050/7165464
The only stupid question is the one not asked!

sem-geologist

  • Professor
  • ****
  • Posts: 301
Re: New method for calibration of dead times (and picoammeter)
« Reply #171 on: May 21, 2023, 12:13:02 AM »
Congratulations with your paper! I really hope community will widely recognize this outstanding problem and adapt the solution as fast as possible. I believe inadequate dead-time corrections could be behind lots of historically created biases and main source of discrepancies of fundamental measurements (like MAC reconstruction with changing acceleration voltage, or matrix match standard requirements...). The only downside (for me) is that only those with ProbeSoftware has this new dead time correction methods available...
« Last Edit: May 21, 2023, 09:00:52 AM by John Donovan »

Probeman

  • Emeritus
  • *****
  • Posts: 2830
  • Never sleeps...
    • John Donovan
Re: New method for calibration of dead times (and picoammeter)
« Reply #172 on: May 21, 2023, 10:33:24 AM »
Congratulations with your paper! I really hope community will widely recognize this outstanding problem and adapt the solution as fast as possible. I believe inadequate dead-time corrections could be behind lots of historically created biases and main source of discrepancies of fundamental measurements (like MAC reconstruction with changing acceleration voltage, or matrix match standard requirements...). The only downside (for me) is that only those with ProbeSoftware has this new dead time correction methods available...

Thank-you SG.

Also your insight and discussion in this topic was much appreciated by all of us in the writing of the paper.  As you know we did thank you (and Ed Vicenzi) in the acknowledgements.

Yes, currently only Probe Software Probe for EPMA (for quant points) and CalcImage (for quant maps) have the new logarithmic dead time expression, but anyone with any software can still perform the constant k-ratio measurements described in the paper and check their dead time and picoammeter calibrations.  I think that is the most important aspect of the paper.

As for the new expression, now that it is published, it can be implemented by Cameca and JEOL if they decide to- it would be very easy!
« Last Edit: May 21, 2023, 03:57:20 PM by Probeman »
The only stupid question is the one not asked!

Probeman

  • Emeritus
  • *****
  • Posts: 2830
  • Never sleeps...
    • John Donovan
Re: New method for calibration of dead times (and picoammeter)
« Reply #173 on: July 26, 2023, 06:31:36 AM »
Maybe this question belongs more in the History of EPMA topic,

https://probesoftware.com/smf/index.php?topic=924.0

but since this topic discusses the constant k-ratio method for determining spectrometer calibrations, maybe it works here too:

So why is a k-ratio called a k-ratio?

Is it because in the beginning, Castaing was taking the ratio of two K emission lines?
The only stupid question is the one not asked!

Probeman

  • Emeritus
  • *****
  • Posts: 2830
  • Never sleeps...
    • John Donovan
Re: New method for calibration of dead times (and picoammeter)
« Reply #174 on: December 22, 2023, 10:05:59 AM »
In case anyone is inspired to run some constant k-ratio calibrations, to determine their dead time constants and picoammeter linearity, over the holiday:

https://probesoftware.com/smf/index.php?topic=1466.msg11173#msg11173

I thought I would provide another example of how the PHA settings should be tuned when attempting to acquire k-ratios from say 10 nA to 200 nA. Remember, always use INTEGRAL mode and adjust your PHAs on the highest concentration of the element, at the highest beam current.  In this case, Ti Ka on Ti metal at 200 nA:


That is, at the highest count rates observed (highest concentration at highest beam current), in the above PHA scans, the Ti escape peaks are fully above the baseline levels, while though the main PHA peaks are off to right, but are still fully counted in INTEGRAL mode. 

At lower count rates (e.g., lower beam currents and/or lower concentrations for example TiO2), your PHA peaks will shift to the right, but because you are in INTEGRAL mode, all photons will still be counted!

Happy holidays!
« Last Edit: December 23, 2023, 09:52:24 AM by Probeman »
The only stupid question is the one not asked!

Probing

  • Graduate
  • **
  • Posts: 8
Re: New method for calibration of dead times (and picoammeter)
« Reply #175 on: March 11, 2024, 03:02:33 PM »
We are pleased to announce the publication of our new paper on improving dead time corrections in WDS EPMA:

John J Donovan and others, A New Method for Dead Time Calibration and a New Expression for Correction of WDS Intensities for Microanalysis, Microscopy and Microanalysis, 2023

https://academic.oup.com/mam/advance-article-abstract/doi/10.1093/micmic/ozad050/7165464

How to get the "best" dead time constant which produces the "best" zero slope "k-ratio v. current" line in your constant k-ratio method? I don‘t have the PROBESOFTWARE, so can I still perform dead time calibration by applying the constant k-ratio method?

Probeman

  • Emeritus
  • *****
  • Posts: 2830
  • Never sleeps...
    • John Donovan
Re: New method for calibration of dead times (and picoammeter)
« Reply #176 on: March 11, 2024, 03:12:32 PM »
We are pleased to announce the publication of our new paper on improving dead time corrections in WDS EPMA:

John J Donovan and others, A New Method for Dead Time Calibration and a New Expression for Correction of WDS Intensities for Microanalysis, Microscopy and Microanalysis, 2023

https://academic.oup.com/mam/advance-article-abstract/doi/10.1093/micmic/ozad050/7165464

How to get the "best" dead time constant which produces the "best" zero slope "k-ratio v. current" line in your constant k-ratio method? I don‘t have the PROBESOFTWARE, so can I still perform dead time calibration by applying the constant k-ratio method?

Yes, you can perform the dead time calibration using the constant k-ratio method for general use as described here:

https://probesoftware.com/smf/index.php?topic=1466.msg11102#msg11102

But if you do not have the Probe for EPMA software, you will not be able to take advantage of the new non-linear expressions described in our paper for count rates above 30 to 50 kcps. In other words, you could perform the dead time calibration using the constant k-ratio method using the traditional linear expression, but you probably won't see a huge difference in the dead time value you obtain below 30 to 50 kcps.  Above those count rates, the tradition linear expression fails as shown in the linked post below.

That said, I think the constant k-ratio method is much easier to use and more precise for dead time calibrations whatever dead time expression is being used...

See here also:

https://probesoftware.com/smf/index.php?topic=1466.msg11173#msg11173
« Last Edit: March 11, 2024, 05:22:02 PM by Probeman »
The only stupid question is the one not asked!

Probing

  • Graduate
  • **
  • Posts: 8
Re: New method for calibration of dead times (and picoammeter)
« Reply #177 on: March 11, 2024, 07:53:19 PM »
We are pleased to announce the publication of our new paper on improving dead time corrections in WDS EPMA:

John J Donovan and others, A New Method for Dead Time Calibration and a New Expression for Correction of WDS Intensities for Microanalysis, Microscopy and Microanalysis, 2023

https://academic.oup.com/mam/advance-article-abstract/doi/10.1093/micmic/ozad050/7165464

How to get the "best" dead time constant which produces the "best" zero slope "k-ratio v. current" line in your constant k-ratio method? I don‘t have the PROBESOFTWARE, so can I still perform dead time calibration by applying the constant k-ratio method?

Yes, you can perform the dead time calibration using the constant k-ratio method for general use as described here:

https://probesoftware.com/smf/index.php?topic=1466.msg11102#msg11102

But if you do not have the Probe for EPMA software, you will not be able to take advantage of the new non-linear expressions described in our paper for count rates above 30 to 50 kcps. In other words, you could perform the dead time calibration using the constant k-ratio method using the traditional linear expression, but you probably won't see a huge difference in the dead time value you obtain below 30 to 50 kcps.  Above those count rates, the tradition linear expression fails as shown in the linked post below.

That said, I think the constant k-ratio method is much easier to use and more precise for dead time calibrations whatever dead time expression is being used...

See here also:

https://probesoftware.com/smf/index.php?topic=1466.msg11173#msg11173

I like to know how the ideal dead time constant is produced. In the example of "TiO2/Ti"  shown in your post, when you found the DT constant (1.32 us) was too high, you dropped it  to 1.28 us and got a more "flat" line. So my question is why it is 1.28, but not 1.27 or 1.29. How is the exact number produced, using some algorithm or by repeated iterate and trial? If the later is the case, how do you determine the observed "k-ratio v. current" line, which depends on the exact DT constant, is the best?

Probeman

  • Emeritus
  • *****
  • Posts: 2830
  • Never sleeps...
    • John Donovan
Re: New method for calibration of dead times (and picoammeter)
« Reply #178 on: March 11, 2024, 09:47:38 PM »
We are pleased to announce the publication of our new paper on improving dead time corrections in WDS EPMA:

John J Donovan and others, A New Method for Dead Time Calibration and a New Expression for Correction of WDS Intensities for Microanalysis, Microscopy and Microanalysis, 2023

https://academic.oup.com/mam/advance-article-abstract/doi/10.1093/micmic/ozad050/7165464

How to get the "best" dead time constant which produces the "best" zero slope "k-ratio v. current" line in your constant k-ratio method? I don‘t have the PROBESOFTWARE, so can I still perform dead time calibration by applying the constant k-ratio method?

Yes, you can perform the dead time calibration using the constant k-ratio method for general use as described here:

https://probesoftware.com/smf/index.php?topic=1466.msg11102#msg11102

But if you do not have the Probe for EPMA software, you will not be able to take advantage of the new non-linear expressions described in our paper for count rates above 30 to 50 kcps. In other words, you could perform the dead time calibration using the constant k-ratio method using the traditional linear expression, but you probably won't see a huge difference in the dead time value you obtain below 30 to 50 kcps.  Above those count rates, the tradition linear expression fails as shown in the linked post below.

That said, I think the constant k-ratio method is much easier to use and more precise for dead time calibrations whatever dead time expression is being used...

See here also:

https://probesoftware.com/smf/index.php?topic=1466.msg11173#msg11173

I like to know how the ideal dead time constant is produced. In the example of "TiO2/Ti"  shown in your post, when you found the DT constant (1.32 us) was too high, you dropped it  to 1.28 us and got a more "flat" line. So my question is why it is 1.28, but not 1.27 or 1.29. How is the exact number produced, using some algorithm or by repeated iterate and trial? If the later is the case, how do you determine the observed "k-ratio v. current" line, which depends on the exact DT constant, is the best?

It is easy. One simply adjusts the dead time constant (depending on which dead time expression is being utilized (because the dead time constant is actually a *parametric* constant as described in the paper) in order to obtain a trend with a slope close to zero.

Therefore, the goal is to obtain a dead time constant (with a suitable dead time expression) that yields a flat (zero slope) response from low count rates to the highest possible count rates.  One can do this visually by inspection because a zero slope is easy to evaluate.

Obviously at some point (above several hundred kcps) the dead time correction becomes very large and quite sensitive to small changes in the dead time constant.  But we found the logarithmic dead time expression can yield quantitative results from zero to several hundred kcps count rates once the dead time value was properly adjusted.

Don't forget, as described in the paper one can also utilize the same constant k-ratio dataset to check their picoammeter linearity and also the agreement of (simultaneous) k-ratios from one spectrometer to another (and even from one instrument to another given the same materials), which can be used to check one's effective take-off angle for each (WDS and EDS) spectrometer.

I've attached the paper to this post for everyone's convenience.
« Last Edit: March 11, 2024, 09:57:37 PM by Probeman »
The only stupid question is the one not asked!