Author Topic: Consensus K-Ratio Measurements  (Read 4238 times)

Probeman

  • Emeritus
  • *****
  • Posts: 2829
  • Never sleeps...
    • John Donovan
Consensus K-Ratio Measurements
« on: March 16, 2022, 12:46:14 PM »
I'm starting a new topic here on the FIGMAS k-ratio consensus measurements.  This topic is related to the Open Letter to the Microanalysis Community on the effort to develop high purity, high accuracy synthetic silicates and oxides in ~kilogram quantities for global distribution to the microanalysis community as discussed here:

https://probesoftware.com/smf/index.php?topic=1415.0

The initial effort involves small amounts of synthetic materials obtained by John Donovan and Will Nachlas, specifically synthetic MgO, Al2O3 and MgAl2O4. Clearly for high accuracy measurements on such different materials the instrument at least needs to have properly calibrated dead time constants. Especially for modern instruments at moderate beam currents and with large area crystals with higher count rates. And especially Cameca instruments with their typically higher dead time constants!

Have you all actually measured the dead time constants on your instruments or are you simply using the "factory defaults"?  It's important for accuracy and it's not hard! Much helpful information is found here for JEOL instrument dead time calibrations:

https://probesoftware.com/smf/index.php?topic=394.0

Here for Cameca instrument dead time calibrations:

https://probesoftware.com/smf/index.php?topic=33.0

And here is found general information on dead time calibrations (also using the StartWin application for an automated dead time data acquisition):

https://probesoftware.com/smf/index.php?topic=1160.0

Of course other instrument calibrations are also very important.  For example, have you checked the accuracy of your high voltage power supply using the Duane-Hunt limit test?

https://probesoftware.com/smf/index.php?topic=1063.0

Or the tilt on your stage (most important for SEMs)!  Or the effective takeoff angle on your spectrometers?  Or the simultaneous k-ratio test on multiple WDS (or EDS!) spectrometers?

https://probesoftware.com/smf/index.php?topic=369.msg1948#msg1948

These are all important things to check especially as the instrument ages over time. In any event, I wanted to share my own efforts to measure k-ratios on these materials and discuss the effect of the dead time calibration on such k-ratio measurements...

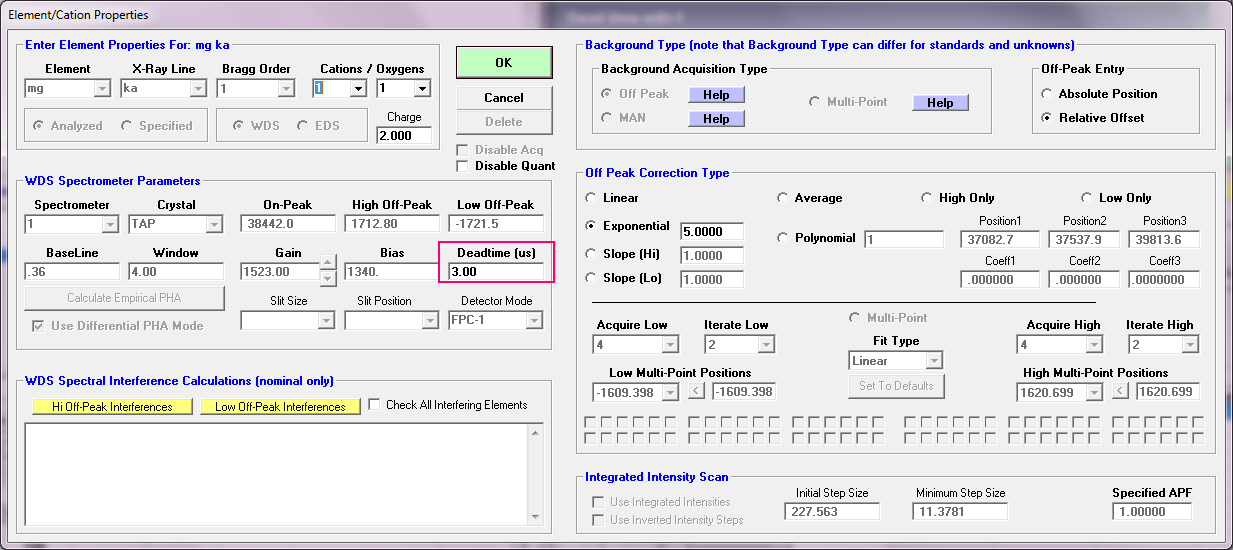
So here are my Mg Ka and Al Ka measurements at 10 nA using element setups that I had (unthinkingly) loaded from 2015 that were using somewhat outdated dead time constants of 3.0 and 2.9 us respectively:

St 3100 Set   3 MgAl2O4 FIGMAS, Results in Elemental Weight Percents
 
ELEM:       Mg      Al       O
TYPE:     ANAL    ANAL    SPEC
BGDS:      EXP     EXP
TIME:    40.00   40.00     ---
BEAM:    10.06   10.06     ---

ELEM:       Mg      Al       O   SUM 
   141  17.399  38.789  44.985 101.174
   142  17.300  38.787  44.985 101.073
   143  17.244  38.544  44.985 100.772
   144  17.250  38.722  44.985 100.958
   145  17.329  38.724  44.985 101.038

AVER:   17.305  38.713  44.985 101.003
SDEV:     .064    .100    .000    .150
SERR:     .029    .045    .000
%RSD:      .37     .26     .00

PUBL:   17.084  37.931  44.985 100.000
%VAR:     1.29    2.06     .00
DIFF:     .221    .782    .000
STDS:     3012    3013     ---

STKF:    .4740   .4353     ---
STCT:   582.29  753.61     ---

UNKF:    .1341   .2700     ---
UNCT:   164.74  467.49     ---
UNBG:      .67     .73     ---

ZCOR:   1.2904  1.4336     ---
KRAW:    .2829   .6203     ---
PKBG:   247.22  639.60     ---

As one can see the values compared to ideal stoichiometry aren't too bad, but both are a little high. Of course one could look at different matrix corrections to double check the accuracy, because the matrix correction effects are quite large at 30% and 43% respectively, as seen here:

Summary of All Calculated (averaged) Matrix Corrections:
St 3100 Set   3 MgAl2O4 FIGMAS
LINEMU   Henke (LBL, 1985) < 10KeV / CITZMU > 10KeV

Elemental Weight Percents:
ELEM:       Mg      Al       O   TOTAL
     1  17.305  38.713  44.985 101.003   Armstrong/Love Scott (default)
     2  17.213  39.034  44.985 101.232   Conventional Philibert/Duncumb-Reed
     3  17.276  38.986  44.985 101.247   Heinrich/Duncumb-Reed
     4  17.307  38.887  44.985 101.179   Love-Scott I
     5  17.301  38.704  44.985 100.990   Love-Scott II
     6  17.248  38.500  44.985 100.733   Packwood Phi(pz) (EPQ-91)
     7  17.451  38.831  44.985 101.267   Bastin (original) Phi(pz)
     8  17.333  39.217  44.985 101.535   Bastin PROZA Phi(pz) (EPQ-91)
     9  17.318  39.096  44.985 101.400   Pouchou and Pichoir-Full (PAP)
    10  17.303  38.915  44.985 101.203   Pouchou and Pichoir-Simplified (XPP)

AVER:   17.305  38.888  44.985 101.179
SDEV:     .062    .211    .000    .225
SERR:     .020    .067    .000

MIN:    17.213  38.500  44.985 100.733
MAX:    17.451  39.217  44.985 101.535

So they all look a little high, so what could be the problem?  Well to me this indicates that there may be a problem with a too low dead time correction since the pure oxide (primary) intensities will be lower than expected if the dead time constants are too low (and your spectrometer dead times will only get longer over time as the instrument ages!). And when I looked at the dead time constants in the PFE Elements/Cations window, sure enough they were from a 2015 dead time calibration I had done 7 years ago of 3.0 us and 2.9 us respectively!


So, one could edit the dead time constants for each element in each sample but that would be tedious. If only there was an easier way, and yes there is. Just go to the Analytical | Update Dead Time Constants menu and open the dialog and select all samples (standards and unknowns) and edit the dead time value for that spectrometer (and crystal) as seen here:


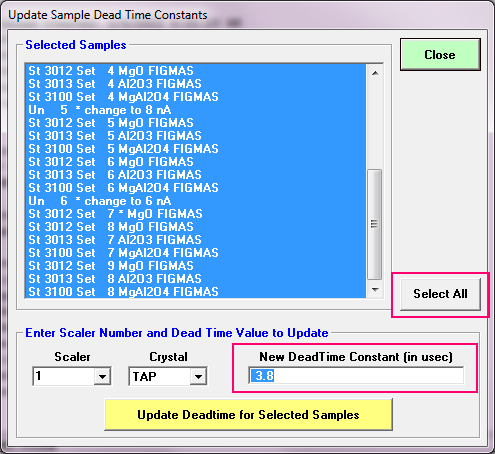
By the way, this Update dead Time Constants dialog automatically loads the current dead time constants from the SCALERS.DAT file (it's almost as though it were exactly designed for such a situation!).    ;D

So using the new calibrated dead time constants (from 2019!) of 3.8 us and 3.5 us respectively for Mg and Al, we obtain the following results:

St 3100 Set   3 MgAl2O4 FIGMAS, Results in Elemental Weight Percents
 
ELEM:       Mg      Al       O
TYPE:     ANAL    ANAL    SPEC
BGDS:      EXP     EXP
TIME:    40.00   40.00     ---
BEAM:    10.06   10.06     ---

ELEM:       Mg      Al       O   SUM 
   141  17.343  38.710  44.985 101.038
   142  17.244  38.708  44.985 100.938
   143  17.188  38.464  44.985 100.637
   144  17.194  38.643  44.985 100.823
   145  17.273  38.645  44.985 100.903

AVER:   17.248  38.634  44.985 100.868
SDEV:     .064    .100    .000    .150
SERR:     .028    .045    .000
%RSD:      .37     .26     .00

PUBL:   17.084  37.931  44.985 100.000
%VAR:      .96    1.85     .00
DIFF:     .165    .703    .000
STDS:     3012    3013     ---

So now we have relative variances of 0.96% and 1.85% respectively, which really isn't too bad at all for extrapolating from pure MgO and Al2O3 to MgAl2O4. But since that 2019 dead time calibration is now about 3 years old, I going to re-run it as soon as I get a chance. Because if I look at a test run at 6 nA (compared to the previous run at 10 nA) I obtain these results:

St 3100 Set   8 MgAl2O4 FIGMAS, Results in Elemental Weight Percents
 
ELEM:       Mg      Al       O
TYPE:     ANAL    ANAL    SPEC
BGDS:      EXP     EXP
TIME:    40.00   40.00     ---
BEAM:     6.03    6.03     ---

ELEM:       Mg      Al       O   SUM 
   216  17.123  38.535  44.985 100.643
   217  17.230  38.581  44.985 100.797
   218  17.053  38.557  44.985 100.595
   219  17.219  38.757  44.985 100.961
   220  17.199  38.502  44.985 100.686

AVER:   17.165  38.587  44.985 100.737
SDEV:     .075    .100    .000    .146
SERR:     .034    .045    .000
%RSD:      .44     .26     .00

PUBL:   17.084  37.931  44.985 100.000
%VAR:      .47    1.73     .00
DIFF:     .081    .656    .000
STDS:     3012    3013     ---

Now we are even closer with relative variances of 0.47% and 1.73% respectively. So I suspect the dead times have increased slightly since 2019 and so I will run a new dead time calibration and report the new results as soon as Julie let's me have some time on the instrument!  😁
« Last Edit: March 16, 2022, 12:57:36 PM by Probeman »
The only stupid question is the one not asked!

Nicholas Ritchie

  • Professor
  • ****
  • Posts: 141
    • NIST DTSA-II
Re: Consensus K-Ratio Measurements
« Reply #1 on: March 17, 2022, 08:31:46 AM »
My experience creating QC systems for multi-laboratory systems is that even "simple samples" identify shortcomings in laboratory procedures.  Part of what excites me about the k-ratio project is that it will allow laboratories to compare their results with other labs in a non-judgemental yet rigorous manner.  EPMA is subtle.  There are many possible ways to introduce small errors that are hard to identify when you don't have a "correct result" to compare against.  Every time I've been involved in one, I've learned something new that improves my procedures.
"Do what you can, with what you have, where you are"
  - Teddy Roosevelt

crystalgrower

  • Professor
  • ****
  • Posts: 79
Re: Consensus K-Ratio Measurements
« Reply #2 on: March 19, 2022, 11:57:09 AM »
Having clean stuff isn’t the whole story.  I learned from doing quarterly round robins of 20 labs, to ask a lot of picky questions.  The most frequent issue was  overdue maintenance of the conducting surface.  The numbers told us to overhaul some labs’ equipment and that greatly improved their data. 

(I don’t have access to FIGMAS)

These questions are intended only to collect useful facts:

What about Faraday cups? In fact the exact Faraday Cup used should be a required entry in the k values database.  Is it an aperture in a well or a separate FC?  Is it mounted in the sample holder as opposed to the actual mount? How is it maintained? 

Another required entry should be the COATING ELEMENT, and its COLOR if on steel.  “Carbon coat” ranges in practice from a gold film to a solid shiny black layer.  Other coatings like Os and Au impact data.   

Anyway, there are already about 400 mounts out there that have the following high purity synthetic materials and a FC.  The  mounts are laid out in a distinctive pattern of 53 materials and were sold under several brand names. There should be at least 400 entries for k values in your database right now  using the following:

Periclase MgO,  “quartz” SiO2, “rutile” TiO2,  “calcite” CaCO3, “cuprite” Cu2O, “fluorite” CaF2,  Cr2O3, Y Al garnet Y3Al5O12.  BUT note that in these mounts, “cassiterite” SnO2 is SINTERED.

Of the sulfides in these mounts, “sphalerite” ZnS,  “galena” PbS, “stibnite” Sb2S3 are high purity synthetics. Cinnabar HgS might be really good or might be porous, I guess you would use the S k value from the known synthetics to verify.

Teaching labs should assign the measurement and calculation of k-values to all courses of “instrumental analysis of minerals” to every student.   Getting people into the habit is important.

For a list of suppliers here is https://probesoftware.com/smf/index.php?topic=1223.msg9443#msg9443
« Last Edit: March 19, 2022, 02:08:42 PM by John Donovan »

Probeman

  • Emeritus
  • *****
  • Posts: 2829
  • Never sleeps...
    • John Donovan
Re: Consensus K-Ratio Measurements
« Reply #3 on: March 21, 2022, 09:14:13 AM »
I was able to run a new dead time calibration this weekend on the SX100.

Remembering the last dead time calibration from several years ago is shown here:

3.8      3.8      3.5      3.5      3.5     "deadtime in microseconds"

The new dead time calibration from this weekend is shown here:

3.9      4.2      3.7      3.6      2.6     "deadtime in microseconds"

So it appears that 4 of the detectors showed increases in dead time since the last calibration, hence the importance of re-running these dead time calibrations every few years or so. The last detector (spectrometer 5) using a PET crystal had a lot of scatter in the plot (see attached spreadsheet below), so I want to re-run the calibration again, this time maybe using the Ti Ka line on Ti metal (PET and LiF crystals).

Eventually, I will edit the SCALERS.DAT file on the probe computer, but in the mean time let's review the last quantitative results from the MgO, Al2O3 and MgAl2O4 FIGMAS mount using a beam current of 10 nA and the dead time constants from 2015:

St 3100 Set   3 MgAl2O4 FIGMAS, Results in Elemental Weight Percents
 
ELEM:       Mg      Al       O
TYPE:     ANAL    ANAL    SPEC
BGDS:      EXP     EXP
TIME:    40.00   40.00     ---
BEAM:    10.06   10.06     ---

ELEM:       Mg      Al       O   SUM
   141  17.343  38.710  44.985 101.038
   142  17.244  38.708  44.985 100.938
   143  17.188  38.464  44.985 100.637
   144  17.194  38.643  44.985 100.823
   145  17.273  38.645  44.985 100.903

AVER:   17.248  38.634  44.985 100.868
SDEV:     .064    .100    .000    .150
SERR:     .028    .045    .000
%RSD:      .37     .26     .00

PUBL:   17.084  37.931  44.985 100.000
%VAR:      .96    1.85     .00
DIFF:     .165    .703    .000
STDS:     3012    3013     ---

Where we see relative variances for Mg and Al of 0.96% and 1.85%. After using the handy dandy Analytical | Update Dead Time Constants menu dialog for the new dead time constants, from this weekend, for spectrometers 1 and 4, we now obtain:

St 3100 Set   3 MgAl2O4 FIGMAS, Results in Elemental Weight Percents
 
ELEM:       Mg      Al       O
TYPE:     ANAL    ANAL    SPEC
BGDS:      EXP     EXP
TIME:    40.00   40.00     ---
BEAM:    10.06   10.06     ---

ELEM:       Mg      Al       O   SUM 
   141  17.336  38.698  44.985 101.020
   142  17.238  38.696  44.985 100.919
   143  17.181  38.452  44.985 100.619
   144  17.188  38.632  44.985 100.804
   145  17.266  38.633  44.985 100.885

AVER:   17.242  38.622  44.985 100.849
SDEV:     .064    .100    .000    .150
SERR:     .028    .045    .000
%RSD:      .37     .26     .00

PUBL:   17.084  37.931  44.985 100.000
%VAR:      .92    1.82     .00
DIFF:     .158    .691    .000
STDS:     3012    3013     ---

So now we have slightly smaller variances of 0.92% and 1.82%, so not a significant difference, but again an accuracy improvement in the right direction.
« Last Edit: March 21, 2022, 09:16:02 AM by Probeman »
The only stupid question is the one not asked!

crystalgrower

  • Professor
  • ****
  • Posts: 79
Re: Consensus K-Ratio Measurements
« Reply #4 on: May 11, 2022, 08:15:10 AM »
Why isn't any other lab posting theirs?

It may be useful to separate the two goals articulated in the Open Letter.

The collection of a k-values database absolutely does not require the creation and distribution of a new materials collection.  Mount makers have been selling high-purity synthetic oxides for over 50 years  and there should be something like 2,000 mounts worldwide that have adequate documentation of purity and supplier. Use google to get links to at least 10 different former and present manufacturers (not resellers).

The highest uptake of a database would be for NIST or a parallel body to set this up formally as a NIST effort.
An online table with space to make entries about k-value with material, known provenance and purity, instrumentation, Faraday cup used for data collection, software used, etc could be created.  The manager would have to back up such a data-entry table daily to prevent deletions.  Other ideas about security don’t  need to be public.

The data should be collated into a second anonymous  table for public distribution.  Absence of identification is necessary to secure widespread participation.

Chemistry and physics societies could help greatly to engage universal participation in a k-values project  because this science is part of their mission. The increase of international linking of physics societies to the American Institute of Physics  has promoted  open access to even archival material that is searchable in English as well as the original language.
In contrast, participation in FIGMAS requires paid membership to a limited list of microscopy societies PLUS a membership fee to FIGMAS itself. 

And to those who purchase materials for any distribution, please consider a more efficient process of material verification.  For example:

Polarized light microscopy of batches of pieces immersed in a petri dish of water or isopropanol is essential. 

Powder XRD on one subsample passing PLM is more than enough to confirm the phase. 

SEM examination of one polished/mounted  subsample will confirm whether the material is sintered—in case the PLM fails to catch this.

If the prior steps show  evidence that the manufacturer’s certificate is unreliable then NO further effort should be made. 

Batch XRF-WDX on 50-100 grams of 2mm loose pieces is the best way to determine  trace contaminants.   NO you are not trying to assay the major component, just the level of contamination.

Wet chemistry that is performed under conditions that guarantee the absence of contamination during dissolution is so expensive that it is really  not a priority.  Some good EPMA materials simply do not dissolve easily.

LA-ICP-MS is absolutely not a batch technique. Neither is EPMA.

Probeman

  • Emeritus
  • *****
  • Posts: 2829
  • Never sleeps...
    • John Donovan
Re: Consensus K-Ratio Measurements
« Reply #5 on: May 11, 2022, 09:12:46 AM »
No one is posting consensus k-ratios here. I'm just sharing my surprise and pleasure with some quant results.  Related to this I'm also collecting k-ratios at different beam currents for the possible purpose of a better dead time calibration procedure.  More on this soon.

In the meantime the FIGMAS group is working with the initial participants and is collating results returned to them for the specific materials currently being distributed.  More materials are "in the pipeline".   I'm as impatient as you are...   :D

Indeed there are many synthetic oxides "out there", but we want to utilize materials that we know are currently available in bulk quantities, so we are starting afresh working with various suppliers.

The characterization of high purity synthetic materials is indeed a separate process from the k-ratio data collection. Your suggestions for bulk purity characterization are helpful. Thanks.
The only stupid question is the one not asked!

John Donovan

  • Administrator
  • Emeritus
  • *****
  • Posts: 3267
  • Other duties as assigned...
    • Probe Software
Re: Consensus K-Ratio Measurements
« Reply #6 on: May 15, 2022, 05:57:48 PM »
We added a new feature to Probe for EPMA to assist in the accurate acquisition of consensus k-ratios.

If you're like some people and utilized element setups from the SETUP.MDB element database or loaded a sample setup from a previous Probe for EPMA run, you probably loaded the element setups, then peaked the spectrometers, checked the PHA settings and maybe even re-ran a wavescan sample to check on your off-peaks, but that might not be enough.

Recently Probeman contacted us to let us know that although he did all of the above, when loading the element setups from previous runs, he neglected to note that the dead time constants for his WDS spectrometers had since been re-calibrated. Therefore that the stored elemental setups still referenced the old dead time constants, from prior to the dead time re-calibration.  And they should of course since they are a record of that calibration!  ::)

But to prevent this from happening again, in the latest version of Probe for EPMA, if one has updated the dead time constants in the SCALERS.DAT file since those element setups were saved, Probe for EPMA will now check for this and provide the following user dialog, if it finds that the dead time constants have been updated since then:


Therefore this new PFE update will allow one to utilize older element setups but with the new dead time calibrations from the SCALERS.DAT file.

Of course one can always manually update these dead time constants "after the fact" using the Analytical | Update Dead Time Constants menu dialog as described here:

https://probesoftware.com/smf/index.php?topic=1442.msg10641#msg10641
« Last Edit: May 15, 2022, 10:15:56 PM by John Donovan »
John J. Donovan, Pres. 
(541) 343-3400

"Not Absolutely Certain, Yet Reliable"

John Donovan

  • Administrator
  • Emeritus
  • *****
  • Posts: 3267
  • Other duties as assigned...
    • Probe Software
Re: Consensus K-Ratio Measurements
« Reply #7 on: August 07, 2022, 09:06:39 AM »
I wanted to mention that the new consensus k-ratio export/import format agreed by Nicholas Ritchie and myself is now documented in the Probe for EPMA User Reference manual and is described here in case anyone else wants to write a script for those using JEOL or Cameca OEM software.

This format (which could change I guess) currently consists of 12 header lines which are pretty self explanatory:

"RegistrationName
"RegistrationInstitution
"Instrument Type (make and model)
"Data File Name"
"User Name"
"File Title"
"File Description"
"Nominal Beam: "
"Database Created:
"Last Updated: "
"Last Modified: "
"Current Date and Time: "

These are followed by the data lines which contain 39 column labels as shown here:

"Sample Name"
"Line Number"
"Date/Time"
"X-pos"
"Y-pos"
"Z-pos"
"Element"
"X-ray"
"Spectro Num"
"Crystal"
"Spectro Orientation"
"Takeoff"
"Kilovolts"
"Nano-amps"
"Beam Size"
"Beam Current"
"Background Type"
"Off Peak Bgd Type"
"On-Peak Pos"
"Hi-Peak Pos"
"Lo-Peak Pos"
"Baseline (volts)"
"Window (volts)"
"Gain"
"Bias (volts)"
"Inte/Diff"
"Detector Type"
"Dead Time (usec)"
"On-Peak Time (sec)"
"Hi-Peak Time (sec)"
"Lo-Peak Time (sec)"
"Unknown Counts (cps/nA)"
"Standard Name"
"Standard Counts (cps/nA)"
"K-Raw"
"Raw On Counts"
"Raw Hi Count"
"Raw Lo Count"
"Raw Off Count"


All these data columns are tab delimited for easy import into Excel. Most of these are pretty self explanatory, but a couple of notes. First the "Spectro Orientation" column is referenced to *North* being zero degrees and proceeds clock-wise around the instrument looking down from the top. 

EDS detectors should be given the spectrometer number zero (even if you have more than one), and the spectrometer orientations will differentiate them.  The column "Crystal" is just a text string so for EDS detectors it could be SDD (10 sq) or SDD (30 sq) or whatever to further facilitate differentiating them.

The on and off-peak positions for EDS systems could simply refer to the emission energy, and the off-peaks could document the range of the ROI fit, or just leave blank for filter methods.

Here is an image loaded into Excel:


This picture was taken pre-Covid but here is a snapshot (by who?) of Nicholas and myself which showed up in my Google "OneDrive" feed this morning:

« Last Edit: August 07, 2022, 09:11:57 AM by John Donovan »
John J. Donovan, Pres. 
(541) 343-3400

"Not Absolutely Certain, Yet Reliable"

John Donovan

  • Administrator
  • Emeritus
  • *****
  • Posts: 3267
  • Other duties as assigned...
    • Probe Software
Re: Consensus K-Ratio Measurements
« Reply #8 on: August 08, 2022, 10:07:43 AM »
Of course I should hasten to add that if you are using Probe for EPMA to acquire your consensus k-ratios, you can simply use the string selection tool in the Analyze! window to select the samples to output (typically the secondary standards), and then right click the sample list to output those selected samples to the consensus k-ratio output format that Nicholas Ritchie and I have come up with:


Or you can output all sample to the consensus k-ratio format using the Output | Save Custom Analysis Output menu...

This is the FIGMAS export/import format that we should be sending our k-ratio data to Will Nachlas and Aurelien Moy.

Of course if you think of anything in this format that you think should be modified, please chime in here!
« Last Edit: August 08, 2022, 01:01:00 PM by John Donovan »
John J. Donovan, Pres. 
(541) 343-3400

"Not Absolutely Certain, Yet Reliable"

Probeman

  • Emeritus
  • *****
  • Posts: 2829
  • Never sleeps...
    • John Donovan
Re: Consensus K-Ratio Measurements
« Reply #9 on: August 10, 2022, 09:01:45 AM »
While at M&M last week we (of course) discussed issues of accuracy in EPMA.

One metaphor I utilized was what I called the "holy trinity of microanalysis".  That is standards, k-ratios and physics.

Standards because of course if our standard compositions are not what we think they are, we will introduce inaccuracy in our analytical results.  This is true whether we utilize high purity synthetic standards or natural matrix matched standards:

https://probesoftware.com/smf/index.php?topic=1483.msg11084#msg11084

K-ratios because that is what we measure, at least on (WDS) EPMA/SEM instruments. And to obtain accurate k-ratios we need to correct not only for beam current and count time, but also dead time, background, standard intensity drift, spectral interferences, time dependent intensity effects (TDI) and even sometimes peak shift/shape effects (APFs).

It is worth mentioning that in Probe for EPMA the reported k-ratios (KRAW) are corrected for all the above items.  This comes in very handy when performing further evaluation and analysis using k-ratios exported from PFE. But as we have been discussing recently we need to make sure that our k-ratios agree not only with all the spectrometers on our own instrument (simultaneous k-ratios), but also with k-ratios measured on other instruments (consensus k-ratios).

And finally physics, because we need to deal with matrix effects of absorption, energy loss, backscatter and fluorescence.  Today we still have some issues with matrix corrections, e.g., backscatter corrections for high Z compounds containing elements disparate A/Z ratios, but matrix corrections have come a long way over the last 30 years.

Now it is my working hypothesis that we have, as a community, tended to drift towards (or remain fixated on) matrix matched standards for several reasons:

Historically our matrix corrections did not model the physics of electron-solid interactions very well, but this has dramatically improved in recent decades. If you are utilizing a modern phi-rho-z method today (with accurate mass absorption coefficients), you are probably in very good hands for most (not all!) matrix situations.

Second, our instruments are not as well calibrated as they ought to be, For many reasons, but particularly the reasons mentioned above: dead time and effective takeoff angles (which by the way, includes sample tilt!). The good news is that using measurements such as the constant k-ratio method we can perform these instrument calibrations and improve our accuracy.

https://probesoftware.com/smf/index.php?topic=1466.msg11075#msg11075

And of course we need to properly correct our k-ratios for background, spectral interferences, TDI effects, etc. using software tools that can handle these issues when they arise.

So, let's start making consensus/constant k-ratio measurements on our instruments and see how well they actually perform.  I'll end with noting that I've attached my M&M presentation of quant mapping below (login to see attachments), because it ends with a few slides regarding the points above.
« Last Edit: August 10, 2022, 09:03:36 AM by Probeman »
The only stupid question is the one not asked!

Probeman

  • Emeritus
  • *****
  • Posts: 2829
  • Never sleeps...
    • John Donovan
Re: Consensus K-Ratio Measurements
« Reply #10 on: September 17, 2022, 08:18:10 AM »
I'm sure this has already occurred to Will Nachlas and Aurelien Moy, but I'll mention it anyway just to get it off my mind.

When performing the consensus k-ratio measurements on the mounts being distributed by Will Nachlas (e.g., the MgO-Al2O3-MgAl2O4 mounts), I suggest that we measure our k-ratios at several electron beam energies. At the very least we should perform these k-ratio measurements at 10, 15 and 20 keV as this additional information will be helpful to build our consensus k-ratio database with Nicholas Ritchie.

Those wanting additional information can find more at this early topic started by Nicholas Ritchie in 2019:

https://probesoftware.com/smf/index.php?topic=1239.0

Also here is the "Open Letter to the Microanalysis Community" started by Probeman on the importance of global standards:

https://probesoftware.com/smf/index.php?topic=1415.0

And also this post from the "constant k-ratio" topic, which stresses the importance of performing k-ratio measurements at multiple beam currents (count rates):

https://probesoftware.com/smf/index.php?topic=1466.msg11166#msg11166

This is to ensure that our:

1. Dead time constants are well calibrated

2. Our picoammeter is well calibrated

3. Our spectrometers (EDS and WDS) produce k-ratios that are consistent with each other. 

See also starting here for more details on using the constant k-ratio method to calibrate your instrument:

https://probesoftware.com/smf/index.php?topic=1466.msg11100#msg11100

Finally a quick reminder that the current version of Probe for EPMA now contains an easy to use menu to export your consensus k-ratio measurements to an external file, for import into the consensus k-ratio database that Nicholas Ritchie is building:

https://probesoftware.com/smf/index.php?topic=40.msg10835#msg10835
« Last Edit: September 17, 2022, 08:30:50 AM by Probeman »
The only stupid question is the one not asked!