Second Section: Extraction of K-ratio Intensities From PAR Files.Continuing our modeling of Ti Ka in SiO2 adjacent to TiO2, we turn our attention to the Calculate Secondary Fluorescence Profiles For The Specified Element and Xray section of the window, and make sure that the Material A (beam incident) is specified as SiO2, Material B (boundary) is specified as TiO2, and Material B Std (primary std) is either the pure element (Ti) or the standard actually used in the measurement on the instrument (e.g., TiO2) as seen here:

Next make sure the correct element and x-ray line is selected, in this case Ti Ka, and that the correct take off angle and beam energy is specified (e.g., 15 keV).
Finally specify the total distance the modeling should cover in microns and the number of points to calculate. The default values of 50 um and 50 points (i.e., 1 um per point) is usually sufficient but can be modified as desired. Note again that because the intensities are reported in linear distances (um), the correct material densities are very important for accuracy.
One can also opt that the quite extensive output file kratio2.dat also be saved to an Excel spreadsheet, but all other output files are automatically saved. For example, For example, this calculation would be saved to a folder named 15_SiO2_TiO2_Ti_22_1 in the C:\UserData\Penepma12\fanal\couple folder. Where 15 is the keV, SiO2 is the beam incident material, TiO2 is the boundary material, Ti is the standard and 22_1 refers to the emitting element and line (1 = Ka, 2 = Kb, 3 = La, etc).
For more information on the data types saved please refer to the Probe for EPMA Reference manual by hitting F1 as shown in the attached screenshot at the end of the post.
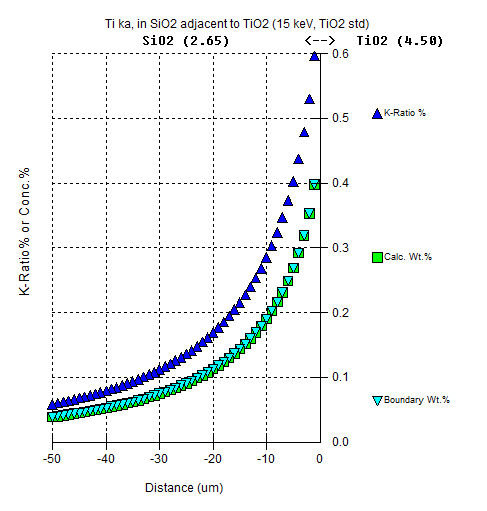
Remember that one needs to be logged in to see attachments!When ready click the Run Fanal (generate k-ratio file for couple boundary) button and after 20 to 30 seconds the data will be displayed in the graph area as shown here:

Note that the material densities and other essential information is displayed in the graph title. The critical information are the k-ratio intensity points. These intensities are utilized in the correction procedure that will be described in the third section.
Several other concentration related data types are plotted as follows:
Boundary Wt.%: This is the concentration of the boundary intensity artifact that is contributed from the boundary material *only*. However since there is no Ti in this SiO2 material, the "Calc Wt.% and the "Boundary Wt.%" plot on top of each other.
In situations where the beam incident material contains a non-zero concentration of the emitted element, the "Calc Wt.% and the "Boundary Wt.%" will plot differently.
Calc Wt.%: The concentration that should be reported if the software was properly noting the fact that the Ti concentration is *not* actually present in the beam incident material (SiO2), but instead is in the boundary material (TiO2). However, since the "spurious" concentration of Ti in the SiO2 is relatively small, the matrix correction of Ti ka in pure SiO2 is approximately 1.202 while the matrix correction for Ti ka in SiO2 with 0.4 wt.% Ti is approximately 1.201. Therefore the former calculation in pure SiO2 is reported as the "Calc. Wt.%, while the latter calculation in SiO2 with a minor amount of Ti is reported as the "Meas. Wt.%".
Meas. Wt.%: As stated above, the "Meas. Wt.%" is the concentration that would be reported by your microprobe software since it incorrectly assumes that the Ti Ka is being emitted in an SiO2 matrix. Of course this reported value is "not even wrong" since the Ti Ka is actually being emitted from the TiO2 boundary phase!
As an aside, the default example of Co ka measured in Cu adjacent to Co, shows an example of how a large artifact affects the assumed matrix correction as seen here:
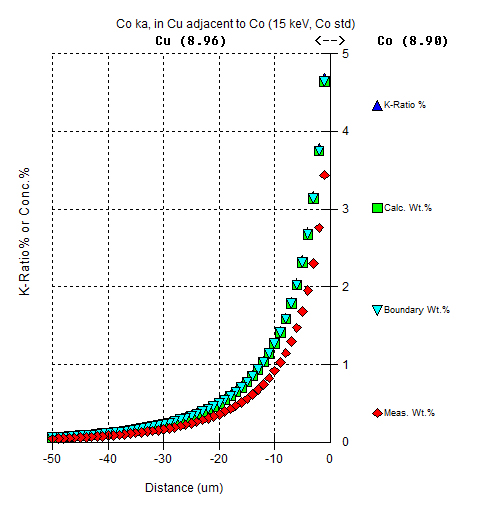
It is interesting to note in the above Co Ka example, that since the beam incident, boundary materials and standard are pure elements, the k-ratio intensities (in %) and Calc. Wt.% concentrations are the same.
Finally it should be mentioned again that since the correction of this artifact utilizes the modeled k-ratio intensities, it is critically important that the correct standard be modeled for use in the third section in the subsequent post. But the pure element is sufficient for general modeling and in fact allows the program to output additional matrix information since the standard k-factor does not need to be calculated.
An example of the Ti Ka in SiO2 adjacent to TiO2 using TiO2 as a standard as opposed to pure Ti is shown here:
Note that the reported concentrations are same but that the k-ratio intensities are quite different due to the use of the TiO2 as the standard instead of Ti.


 We depend on your feedback and ideas!