Author Topic: Probe for EPMA Presentations and Tutorials  (Read 9755 times)

John Donovan

  • Administrator
  • Emeritus
  • *****
  • Posts: 3275
  • Other duties as assigned...
    • Probe Software
Probe for EPMA Presentations and Tutorials
« on: September 08, 2015, 12:09:53 PM »
Attached below are the M&M tutorials presented by Drs. Julien Allaz and Karsten Goemann last month in Portland. Remember you must be logged in to see attachments! The titles were:

Dr. Julien Allaz: "Easy Acquisition and High Accuracy Quantitative Analysis in Probe for EPMA"

Dr. Karsten Goemann: "Multi-Point and Shared Backgrounds- Ultimate EPMA Accuracy for Traces in Complex Matrices"

Feel free to attach any additional presentations or tutorials you may have given which focus on Probe for EPMA in this topic.

Edit: Karsten's tutorial pdf file was damaged in the original upload.  It is fixed now, so please try again.
« Last Edit: September 09, 2015, 08:40:20 AM by John Donovan »
John J. Donovan, Pres. 
(541) 343-3400

"Not Absolutely Certain, Yet Reliable"

Xudong Che

  • Student
  • *
  • Posts: 1
Re: Probe for EPMA Presentations and Tutorials
« Reply #1 on: September 08, 2015, 07:58:44 PM »
Thanks John, I downloaded them. Xudong

John Donovan

  • Administrator
  • Emeritus
  • *****
  • Posts: 3275
  • Other duties as assigned...
    • Probe Software
Re: Probe for EPMA Presentations and Tutorials
« Reply #2 on: March 29, 2016, 07:53:04 AM »
Here is a tutorial on how to utilize the TDI (Time Dependent Intensity) "volatile" correction for quantitative analysis by one of our specialists. See attached pdf below (remember to log in to see attachments).

Please let us know if you see anything that could be improved.
John J. Donovan, Pres. 
(541) 343-3400

"Not Absolutely Certain, Yet Reliable"

gmorgan@ou.edu

  • Guest
Re: Probe for EPMA Presentations and Tutorials
« Reply #3 on: April 19, 2016, 10:06:50 AM »
Thanks for the tutorial - it's nicely spelled out. Bear in mind, however, that there are some practical aspects that can make the TDI correction quite "IFFY" for some applications, especially much of what I do with hydrous rhyolitic glasses.

One issue is that the TDI correction is performed only for the first elements acquired on each spectrometer (logically), which makes a hard choice for me. One of the compositional parameters we focus on is Aluminum Saturation Index (=molec. Al/(2Ca+Na+K+Rb+Cs)). Unless the glasses are very simple in composition, allowing for the use of three TAP crystals, TDI can't be done for Al, Si, and Na. So, because Na is the mobile culprit it must be done first. If only two TAP crystals are available, that leaves a choice between Al and Si being done first on the second spectro. Better accuracy for the ASI would be obtained by analyzing Al first (minimizing both intensity "grow-in" and uncertainty from the fact that Na absorbs Al Ka more strongly than Si). However, if Al is analyzed first then Si goes uncorrected, and because of its higher concentration in geologically relevant glasses its concentration will be much more strongly affected by Na loss from the excitation volume - resulting in fictively high Si results. I have obtained analytical totals in the 102-105 wt% range using TDI on rhyolitic glasses when Na and Al are done first when using conditions (say, 2 nA and 5 um spot) that cause even modest Na volatility.

A second issue I have is that I commonly analyze hydrous glasses. The TDI behavior varies significantly with H2O content of glass, and I have noted in H2O-saturated granitic glasses (6-7 wt% H2O) that a large proportion of the Na migration (up to at least 30%, maybe more) can occur during the first second of irradiation at high current densities. So if the current density is high, the  TDI correction at best produces Na values that would be 10-30% low.

So the TDI correction is great and can be very useful, but don't believe it can completely get around the effects of element volatilization if you don't do everything you can to minimize it in the first place (like using multiple combined conditions in which the major elements are done first at low current density - say 2 nA and 20 um spot if possible).

Probeman

  • Emeritus
  • *****
  • Posts: 2836
  • Never sleeps...
    • John Donovan
Re: Probe for EPMA Presentations and Tutorials
« Reply #4 on: April 19, 2016, 10:22:22 AM »
One issue is that the TDI correction is performed only for the first elements acquired on each spectrometer (logically), which makes a hard choice for me. One of the compositional parameters we focus on is Aluminum Saturation Index (=molec. Al/(2Ca+Na+K+Rb+Cs)). Unless the glasses are very simple in composition, allowing for the use of three TAP crystals, TDI can't be done for Al, Si, and Na.

We routinely run Si, Al, Na and K as the first elements using only two TAP crystals as seen here:


Nothing wrong with running Si on PET- it's a major element and doesn't need the sensitivity that a low sin theta would get you.
john
« Last Edit: April 12, 2020, 07:06:32 PM by John Donovan »
The only stupid question is the one not asked!

Probeman

  • Emeritus
  • *****
  • Posts: 2836
  • Never sleeps...
    • John Donovan
Re: Probe for EPMA Presentations and Tutorials
« Reply #5 on: August 20, 2016, 11:20:34 AM »
The following mini-tutorial might seem to be only appropriate for beginners, but even veteran EPMA'ers can forget to perform proper background checks when working quickly- as recently occurred in my lab when I was performing a "rush job" for a client.

Admittedly it's a complex matrix: CdSCuInGaSe plus O and Na. But even though it's drop dead simple in Probe for EPMA to run a wavescan on all elements with just a single click, I somehow managed to forget this important step, and so after the thin film K vs. Hv fits didn't look quite a good as usual, I realized I had forgotten to acquire a wavescan to check for appropriate off-peak background positions.

Those wavescans, some of which are shown here, display the default backgrounds that were loaded in from the user element setup database, in putting together this new run. The green vertical lines show the default off-peak backgrounds originally (and wrongly!) utilized for the quantification, the magenta vertical lines show the manually selected off-peak positions that were subsequently utilized for the improved 2nd quantitative acquisition.

For example, here is Se La which shows the default low side off-peak background is sitting partially on the Se Lb4 emission line:


Of course this doesn't actually cause a severe problem with the quantification because the Se La and Lb4 lines will scale together, but it does reduce the peak to background ratio.

Next is Na Ka which shows the default low side off-peak severely interfered by Ga *and* In:


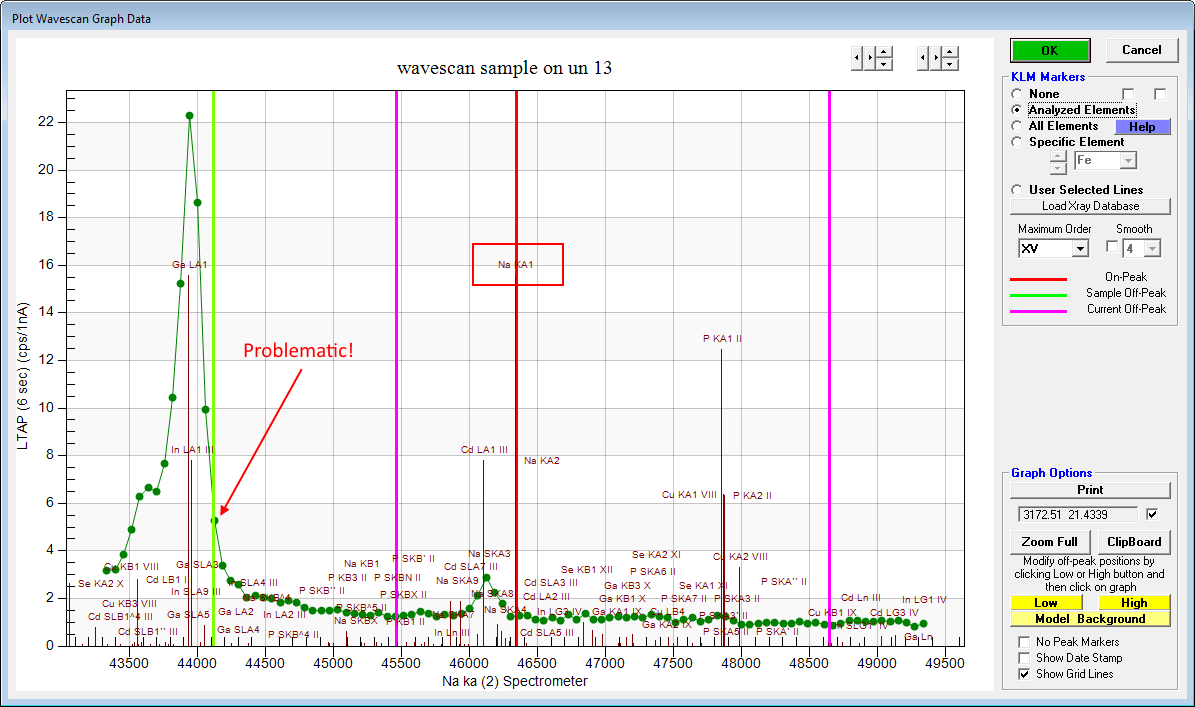
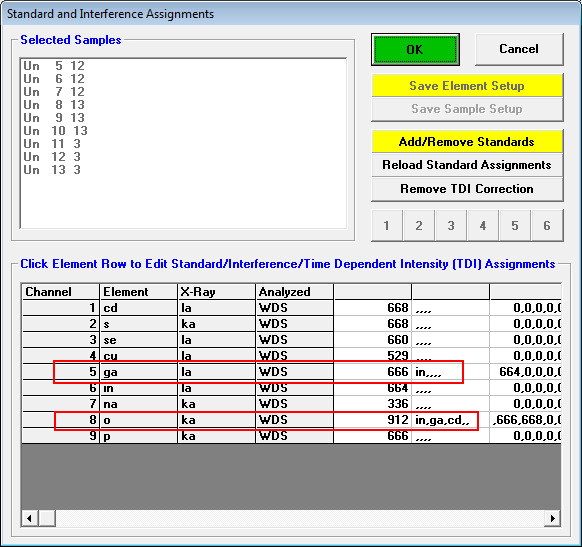
This problematic off-peak interference will produce significantly negative k-ratios (not to mention that we will need to perform an interference correction for In (III) on Ga La).  By the way, here are the interferences that we had to correct for in this matrix:


Next we examine O ka, which has a very complicated spectrum:


It's difficult to select background positions which are not interfered with, but by choosing off-peak positions relatively close to the emission line we can obtain a relatively decent, though not perfect fit as seen here:


Bottom line: don't forget to check your off-peak positions (as I recently did!), for accurate quantification!
john
« Last Edit: April 12, 2020, 07:07:01 PM by John Donovan »
The only stupid question is the one not asked!

Probeman

  • Emeritus
  • *****
  • Posts: 2836
  • Never sleeps...
    • John Donovan
Re: Probe for EPMA Presentations and Tutorials
« Reply #6 on: October 25, 2017, 12:30:36 PM »
I gave my presentation on using MAN (mean atomic number) and MPB (multi-point background) corrections for trace elements in the GSA Magma to Volcano session this morning and there were several good questions asked at the end of my talk.  See the talk attached below (remember to log in to see attachments).

A question by John Fournelle was particularly interesting and I had some additional thoughts on it. His question was: you said that background is generally the lowest thing we can measure, does the MAN correction handle situations where there are "holes" in the continuum?

And I immediately thought of the "hole" in the background when measuring trace gold (Au La) in pyrite, which is caused by an absorption edge within the sample, and my answer was: no, but this can be corrected for using a blank correction. Pure pyrite standards are easily obtained for this purpose.

But afterwards I realized that if the "hole" in the background spectrum is instead caused by secondary Bragg diffraction in the analyzing crystal of the spectrometer (as is often seen in some PET, especially in large PET) crystals, then no blank correction is necessary, since this "hole" will affect all the standards used in the MAN calibration curve.

Interesting.
john

Edit: a couple of the slides in the presentation are modified from Karsten Goemann. I should have noted that in the PPT file.
« Last Edit: October 25, 2017, 03:54:10 PM by Probeman »
The only stupid question is the one not asked!

John Donovan

  • Administrator
  • Emeritus
  • *****
  • Posts: 3275
  • Other duties as assigned...
    • Probe Software
Re: Probe for EPMA Presentations and Tutorials
« Reply #7 on: October 01, 2018, 01:22:11 PM »
I've been asked to describe how the analysis results in Probe for EPMA are displayed so I thought I would document that here for the benefit of others.

Because Probe for EPMA GUI is so "sample centric", the analysis results are very prominently visible in the application.  There is of course the main log window where all acquisition data and results are displayed, but also the Analyze! window where the results are summarized for each sample. A sample being a group of elements (element setup) with specified conditions and zero to n data points. That is every sample has n data points with an average, standard deviation, etc., etc.

Here are the quantitative results from a sample displayed is the log window (which can be elemental, oxide, atomic, formula basis, etc., etc.):


If one scrolls further down in the log window, one can see the summary statistics and parameters for each element:


The same results are also visible in the Analyze! window as seen here:


One can also "drill down" into each point analysis for extended display of other data types (which are also displayed in the log window and Analyze! window) by double-clicking on a single point as seen here:


One can also export these and many other data types to tab delimited ASCII files and directly into Excel as seen here:


This is just a tiny part of the analysis results that are available in Probe for EPMA. Please let me know if there is any thing else you are curious about.
« Last Edit: October 01, 2018, 01:29:41 PM by John Donovan »
John J. Donovan, Pres. 
(541) 343-3400

"Not Absolutely Certain, Yet Reliable"

John Donovan

  • Administrator
  • Emeritus
  • *****
  • Posts: 3275
  • Other duties as assigned...
    • Probe Software
Re: Probe for EPMA Presentations and Tutorials
« Reply #8 on: August 30, 2022, 07:47:47 AM »
Karsten already posted this short tutorial how to use the new, more automated image calibration procedure in the Imaging window to a separate topic, but I attach it here also since this topic is "sticky".

See attached PDF.
« Last Edit: August 30, 2022, 07:50:57 AM by John Donovan »
John J. Donovan, Pres. 
(541) 343-3400

"Not Absolutely Certain, Yet Reliable"