Author Topic: PHA anomalies  (Read 6673 times)

Brian Joy

  • Professor
  • ****
  • Posts: 296
PHA anomalies
« on: June 19, 2015, 02:27:55 PM »
Hi everyone,

I have a question about SCA pulse amplitude distribution behavior:  I've noticed that the distribution obtained from the JEOL large-area and "high intensity" (Johansson geometry) PET and LiF crystals (with sealed Xe detector) can differ very markedly from that observed using "normal" PET and LiF crystals.  As an example, I've embedded some images of the pulse amplitude distributions collected on Au La using LiF, LiFL, and LiFH.  In each case the distribution was collected with a gain factor of 32 and the bias adjusted to produce a distribution centered at 4 V.  Count rate in each case was 6000-7000 /s.  In the first image (LiF), the distribution appears "normal," with the Xe escape peak small but clearly visible at ~2.3 V.  However, in the distributions collected using LiFL and LiFH, a large secondary distribution of pulse amplitudes occurs at higher amplitudes; the position of the center of the secondary distribution differs substantially between LiFL and LiFH.

Does anybody know the cause of this distribution of pulse amplitudes centered at higher voltage than the main distribution?  I've wondered about this intermittently for quite a while.  I was reminded of it just recently because I needed to set a window around the distribution for Ti Ka (using PETH) in order to suppress some minor interference from Hf Lb1(2).  I ended up simply setting the window around the main distribution.  How have other people approached this problem?

LiF (Au La):


LiFL (Au La):


LiFH (Au La):
« Last Edit: June 19, 2015, 05:45:29 PM by Brian Joy »
Brian Joy
Queen's University
Kingston, Ontario
JEOL JXA-8230

Paul Carpenter

  • Professor
  • ****
  • Posts: 46
    • Washington University Analytical Facilities
Re: PHA anomalies
« Reply #1 on: June 23, 2015, 03:55:24 PM »
Hi Brian,

At higher count rates one sees pulse pileup on the PHA scan. For a nominal 4 V setting one would
see a coincidence peak at 8 V that may smear out into a shelf since you could as well have noise
peaks that are combined with x-ray pulses.

The doublet on a sealed Xe counter may be related to incomplete recombination of the Xe ions and
electrons resulting in a ghost image. We have this on one of our sealed counters. I do not see any
degradation in performance but it may be that at higher count rates (like on a large crystal) that
there is an effect and it would be most pronounced if differential mode was used.

My mantra is to use differential mode only when necessary, integral mode for all other work. If you
look at a PHA scan for Carbon you will see how the pulse distribution is spread out from baseline noise
to the upper range of the PHA scan so that differential mode does not make sense.

It is my understanding that the sealed Xe counters need to be replaced every few years, you do not
say the age of your instrument.

My second mantra is to use higher gain with lower bias on the Jeol in order to prolong the life of the
detectors.

Cheers,

Paul
Paul Carpenter
Washington University St. Louis

Probeman

  • Emeritus
  • *****
  • Posts: 2826
  • Never sleeps...
    • John Donovan
Re: PHA anomalies
« Reply #2 on: June 23, 2015, 04:20:41 PM »
My mantra is to use differential mode only when necessary, integral mode for all other work. If you
look at a PHA scan for Carbon you will see how the pulse distribution is spread out from baseline noise
to the upper range of the PHA scan so that differential mode does not make sense.

Just to reiterate what Paul said, there is usually no good reason to have tight PHA windows, they can reduce higher order interferences a bit, but I almost always use a wide window, or none at all, as Paul's "mantra" suggests, to avoid non-linear intensity changes.

In Probe for EPMA performing quant interference correction is usually trivial and the benefit is that one can get better accuracy doing the proper interference correction than trying to rely on PHA energy filtering, which can create non-linear detector responses as the count rate changes between standard and unknown intensities.
The only stupid question is the one not asked!

Brian Joy

  • Professor
  • ****
  • Posts: 296
Re: PHA anomalies
« Reply #3 on: June 23, 2015, 08:40:44 PM »
Hi Paul and John,

Thanks for your thoughts on this.

Regarding the age of the instrument, it was installed in Spring, 2011.  I’ve noted the occurrence of the anomalous PHA behavior in the Xe detectors for at least the past three years or so (though it may well have been present from the beginning -- I wasn’t necessarily looking for it at first).

Note that, when I collected the above PHA scans on Au La, the count rate on each spectrometer was roughly identical and not abnormally high (6000-7000 /s), i.e., I used a different beam current to collect each scan.  So I don't think that pulse pileup could explain the behavior.

I don’t have PfE (it’s on my wish list), and I find that the JEOL peak overlap corrections can be difficult to implement, especially when the concentration of the element of interest is low.  Also, the JEOL software does not take into account matrix effects on the overlap correction.

I only apply pulse amplitude discrimination sparingly and with a great deal of care, and I realize that 2nd-order reflections can be virtually impossible to remove completely.  When I do operate in differential mode, I am very careful to monitor shifts in the pulse amplitude distribution with count rate.  In general, on the standard, I make sure that the count rate is no greater than about 5000 /s or is similar to that on the unknown.  Also, I always use relatively low detector bias (generally 1600-1700 V) in order to further minimize the shift with count rate.  I always set the window wide enough so that a small shift in position of the distribution with changing count rate will not cause a substantially non-linear detector response.  In the case of PETH/LIFH, though, I end up excluding a significant fraction of X-ray counts simply by centering the window around the most prominent part of the distribution at/near 4 V.
« Last Edit: June 23, 2015, 09:15:28 PM by Brian Joy »
Brian Joy
Queen's University
Kingston, Ontario
JEOL JXA-8230

Brian Joy

  • Professor
  • ****
  • Posts: 296
Re: PHA anomalies
« Reply #4 on: December 15, 2015, 10:33:09 AM »
Several months ago, I posted regarding anomalous PHA behavior that I observed on two of our sealed Xe detectors (JEOL JXA-8230, installed 2011) when counting relatively high-energy X-rays.  (I found that the anomalous behavior was not present for X-ray energies less than ~2.5 keV).  JEOL agreed to replace both detectors under the service contract (which expires in late January, unfortunately).  Otherwise the detectors would have cost $6k US each, which converts poorly into Canadian currency these days.

Below I’ve embedded images comparing PHA scans on Au La using the new detectors versus old.  The pulse amplitude distributions now appear normal, with no secondary peaks at high amplitude.  In all cases, the scans were collected at count rates between 6000 and 7000 /s.

For a given electronic gain factor (32x in this case) and count rate, obtaining a distribution centered at 4 V now requires a bias nearly 90 V less than with the old detectors (which were the original detectors).


LiFL/Au La – new detector – 15 December 2015


LiFL/Au La – old detector – 19 June 2015


LiFH/Au La – new detector – 15 December 2015


LiFH/Au La – old detector – 19 June 2015

« Last Edit: December 15, 2015, 01:12:52 PM by Brian Joy »
Brian Joy
Queen's University
Kingston, Ontario
JEOL JXA-8230

Probeman

  • Emeritus
  • *****
  • Posts: 2826
  • Never sleeps...
    • John Donovan
Re: PHA anomalies
« Reply #5 on: December 16, 2015, 03:42:38 PM »
Several months ago, I posted regarding anomalous PHA behavior that I observed on two of our sealed Xe detectors (JEOL JXA-8230, installed 2011) when counting relatively high-energy X-rays.  (I found that the anomalous behavior was not present for X-ray energies less than ~2.5 keV).  JEOL agreed to replace both detectors under the service contract (which expires in late January, unfortunately).  Otherwise the detectors would have cost $6k US each, which converts poorly into Canadian currency these days.

Below I’ve embedded images comparing PHA scans on Au La using the new detectors versus old.  The pulse amplitude distributions now appear normal, with no secondary peaks at high amplitude.  In all cases, the scans were collected at count rates between 6000 and 7000 /s.

For a given electronic gain factor (32x in this case) and count rate, obtaining a distribution centered at 4 V now requires a bias nearly 90 V less than with the old detectors (which were the original detectors).


LiFL/Au La – new detector – 15 December 2015


LiFL/Au La – old detector – 19 June 2015


LiFH/Au La – new detector – 15 December 2015


LiFH/Au La – old detector – 19 June 2015


Hi Brian,
I wonder if these PHA peak artifacts are from contamination or pumping out?  Does anyone know?

I've heard Colin McCrae at CSIRO say that one needs to replace the JEOL sealed Xe detectors every 3 to 4 years...  the Cameca flow detectors may have crappy high energy sensitivity, but at least they last forever!   :P
The only stupid question is the one not asked!

Brian Joy

  • Professor
  • ****
  • Posts: 296
Re: PHA anomalies
« Reply #6 on: June 04, 2018, 07:49:40 PM »
Resurrecting an old thread...

I’m in the midst of evaluating the performance of our three Xe-filled detectors.  Two of them (on channels 2 and 5) were replaced in December, 2015, while the third (channel 3) has been in service since October, 2011.  Channel 5 contains “high intensity” LiF and PET diffracting crystals, channel 2 contains large-area LiF and PET crystals, and channel 3 contains “normal” LiF and PET crystals.  Compared to what I observed in December, 2015, all counters require an increase in anode voltage in order to obtain pulse amplitude distributions centered at 4 V.  In all cases I collect the distributions after adjusting the count rate at the peak to ~5000 s-1.


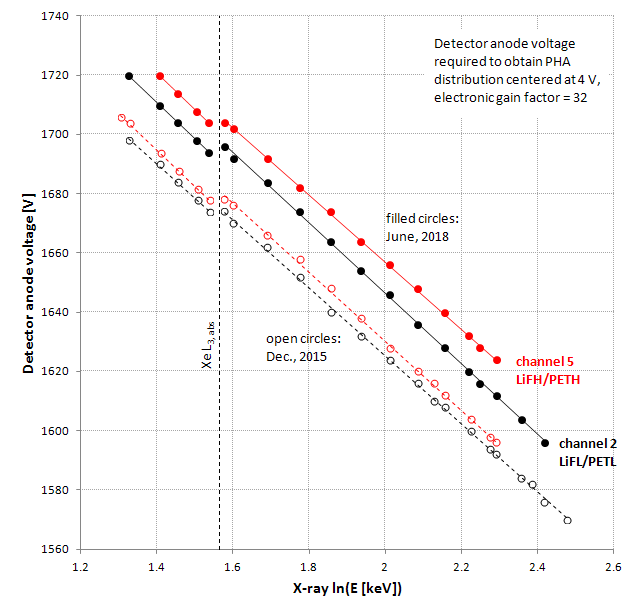
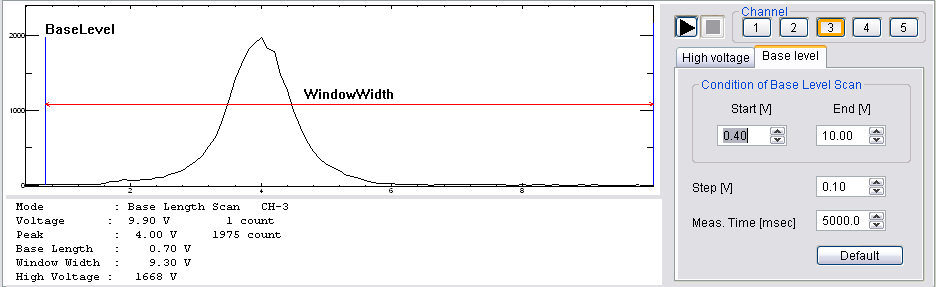
Channel 5, which in normal service produces the highest count rates for a given X-ray line is showing evidence again of formation of a “ghost” peak at amplitudes just above the main peak in the PHA distribution.  The distribution for channel 2 is still the typical semi-Gaussian distribution.  The counter on channel 3, which gives the lowest count rates of the three channels, is showing formation of a tail on the low-amplitude side of the distribution; the tail is present for a wide range of X-ray energies below Xe L3,abs.  It may also be present at high energy but is obscured by the Xe escape peak. That tail, which is somewhat subtle, is illustrated here for Sn La:


It makes sense that the counter on channel 5, which receives more ionizing radiation than the other two counters, would be expected to show the most rapid deterioration in performance. This may be due, for instance, to contamination of the anode by breakdown products of the C-rich quench gas (CH4 or CO).  Relative to the main peak in the pulse amplitude distribution, the height of the ghost peak observed on channel 5 varies with X-ray energy.  For X-ray lines with energies above that of the Xe L3 absorption edge, the height of the ghost peak decreases with decreasing X-ray energy, though it is still visible, for instance, for V Ka.  With further decrease in X-ray energy, for lines of energy just below Xe L
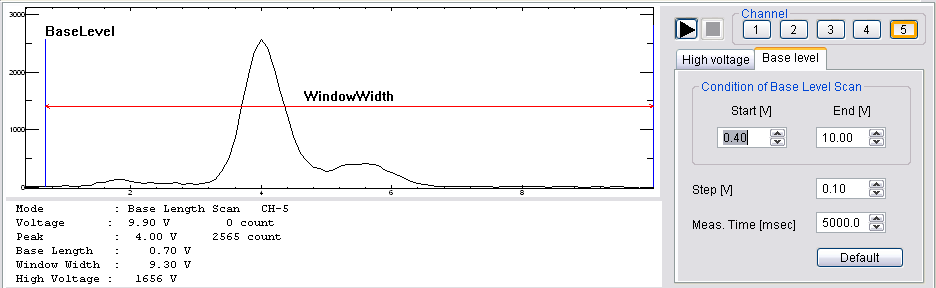
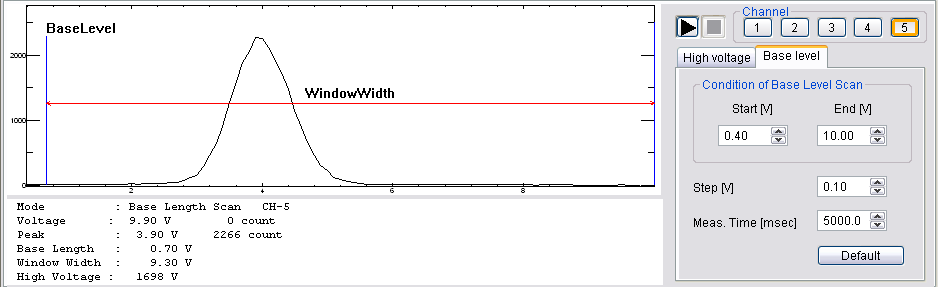
3,abs (e.g., La La and Ti Ka), a prominent ghost peak reappears, but is closer to the main peak than for X-ray lines of higher energy.  Once again, as X-ray energy decreases, this ghost peak becomes less prominent and then disappears completely for X-rays of energies less than about 2.5 keV.  See the sequence of PHA scans below, which are arranged in order of decreasing X-ray energy.

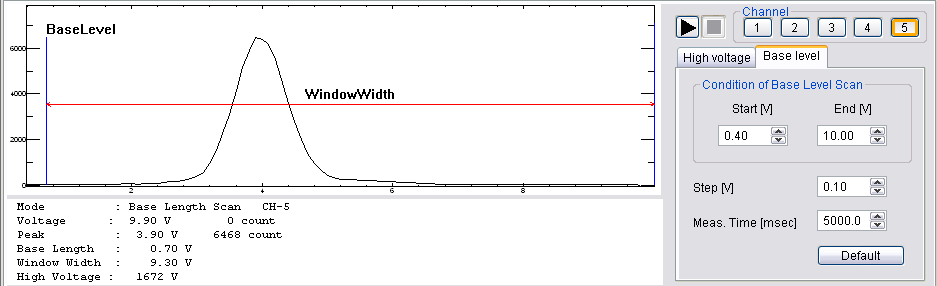
Ge Ka (9.874 keV, gain = 32, bias = 1624 V):


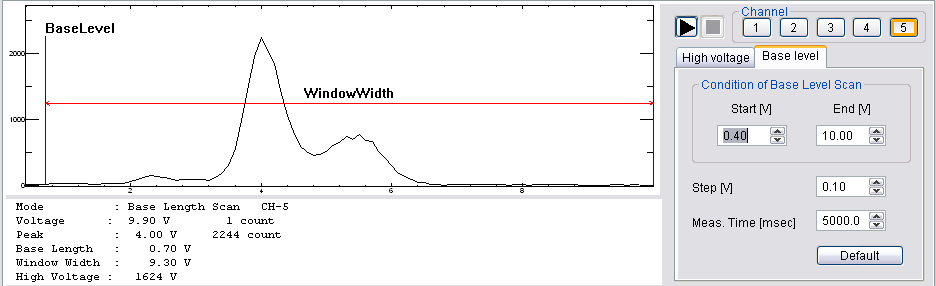
Ni Ka (7.471 keV, gain = 32, bias = 1656 V):


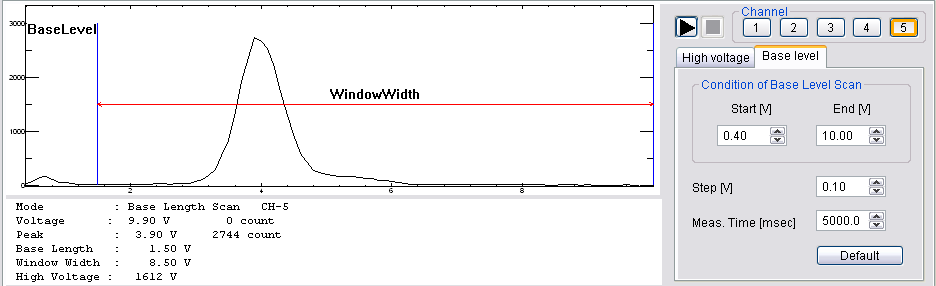
V Ka (4.949 keV, gain = 64, bias = 1612 V):


----------------------------- Xe L3, abs (4.783 keV) -----------------------------

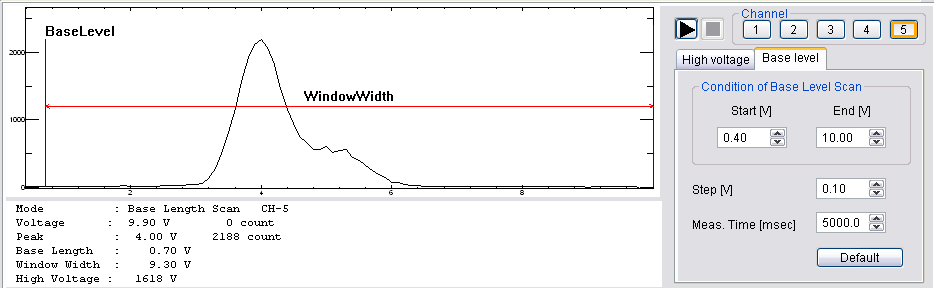
Ti Ka (4.508 keV, gain = 64, bias = 1618 V):


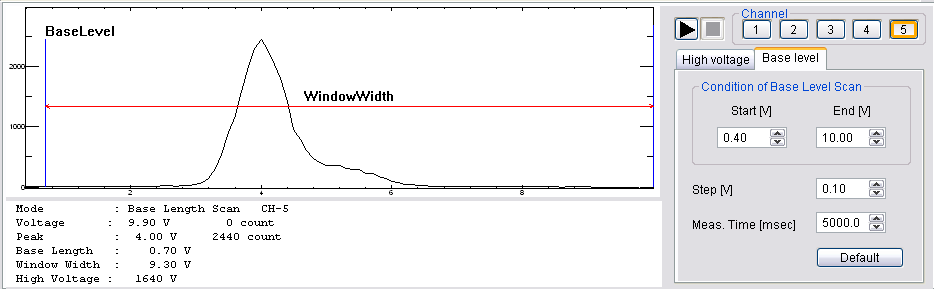
Te La (3.769 keV, gain = 64, bias = 1640 V):


Ag La (2.984 keV, gain = 64, bias = 1672 V):


Mo La (2.293 keV, gain = 64, bias = 1698 V):

« Last Edit: April 12, 2020, 03:05:18 PM by John Donovan »
Brian Joy
Queen's University
Kingston, Ontario
JEOL JXA-8230

Probeman

  • Emeritus
  • *****
  • Posts: 2826
  • Never sleeps...
    • John Donovan
Re: PHA anomalies
« Reply #7 on: June 05, 2018, 07:44:31 AM »
I haven't owned an instrument with sealed Xe detectors since the 80's (does anyone remember the ARL SEMQ?), but this makes a lot of sense. Sealed detectors continue to get more contaminated over time due to outgassing from the detector walls which makes them more noisy over time.  Colin MacRae says he replaces his JEOL sealed detectors every two or three years because of this. 

There's also the issue of the gas pressure. What you are seeing I suspect is also due to "pumping out" where due to very small leaks in the detector body, the Xe slowly leaks over time into the sample chamber and the gas inside the detector becomes more rarefied. Thus requiring more voltage over time.

That's one of the tradeoffs with JEOL vs Cameca.  Cameca (2 atm) flow detectors don't have the high energy sensitivity of the sealed Xe detectors, but they will say useful for 20 years or so because they don't get pumped out, and the contamination rate is much lower.

It would be interesting to compare P/B values for a couple of emission lines over time.  Do you see a decrease in P/B for the sealed detectors compared to the flow detectors?
« Last Edit: June 05, 2018, 09:56:50 AM by Probeman »
The only stupid question is the one not asked!

Brian Joy

  • Professor
  • ****
  • Posts: 296
Re: PHA anomalies
« Reply #8 on: June 05, 2018, 12:53:54 PM »
It would be interesting to compare P/B values for a couple of emission lines over time.  Do you see a decrease in P/B for the sealed detectors compared to the flow detectors?

I haven't had a chance to look at this in detail yet; however, when I compare P/B for Ni Ka on channel 5/LiFH over the past year using the same standard (synthetic Ni2SiO4), accelerating potential (15 kV), beam current (20 nA), and background offsets, the value has remained consistently around ~100.  So my quick answer would be "no."  Note that the value would presumably be affected by variation in crystal and baseplate alignment over time.
Brian Joy
Queen's University
Kingston, Ontario
JEOL JXA-8230

Probeman

  • Emeritus
  • *****
  • Posts: 2826
  • Never sleeps...
    • John Donovan
Re: PHA anomalies
« Reply #9 on: June 05, 2018, 01:09:51 PM »
It would be interesting to compare P/B values for a couple of emission lines over time.  Do you see a decrease in P/B for the sealed detectors compared to the flow detectors?

I haven't had a chance to look at this in detail yet; however, when I compare P/B for Ni Ka on channel 5/LiFH over the past year using the same standard (synthetic Ni2SiO4), accelerating potential (15 kV), beam current (20 nA), and background offsets, the value has remained consistently around ~100.  So my quick answer would be "no."  Note that the value would presumably be affected by variation in crystal and baseplate alignment over time.

Interesting but I wouldn't expect to see much of a change over only a year. In fact I would think that most of the contamination would occur in the first year or two. The "pumping out" effects would be more linear I'm guessing.
« Last Edit: June 05, 2018, 01:12:07 PM by Probeman »
The only stupid question is the one not asked!

Brian Joy

  • Professor
  • ****
  • Posts: 296
Re: PHA anomalies
« Reply #10 on: June 05, 2018, 04:36:49 PM »
It would be interesting to compare P/B values for a couple of emission lines over time.  Do you see a decrease in P/B for the sealed detectors compared to the flow detectors?

I haven't had a chance to look at this in detail yet; however, when I compare P/B for Ni Ka on channel 5/LiFH over the past year using the same standard (synthetic Ni2SiO4), accelerating potential (15 kV), beam current (20 nA), and background offsets, the value has remained consistently around ~100.  So my quick answer would be "no."  Note that the value would presumably be affected by variation in crystal and baseplate alignment over time.

Interesting but I wouldn't expect to see much of a change over only a year. In fact I would think that most of the contamination would occur in the first year or two. The "pumping out" effects would be more linear I'm guessing.

Below is a selection of calibrations on channel 5/LiFH for Fe Ka using synthetic fayalite as the standard; these calibrations span the lifetime of the counter currently in place.  I don't see any obvious effect of detector aging on P/B.  In September, 2016, I realigned the LiFH crystal, and this caused a very marginal increase in P/B.  A much more significant improvement occurred when the power supply to the static filter was reattached in January, 2017, as this prevented BSE-induced ionizations within the counter gas, thus reducing or eliminating their contribution to continuum radiation.

« Last Edit: April 12, 2020, 03:05:38 PM by John Donovan »
Brian Joy
Queen's University
Kingston, Ontario
JEOL JXA-8230

Probeman

  • Emeritus
  • *****
  • Posts: 2826
  • Never sleeps...
    • John Donovan
Re: PHA anomalies
« Reply #11 on: June 05, 2018, 04:47:14 PM »
Below is a selection of calibrations on channel 5/LiFH for Fe Ka using synthetic fayalite as the standard; these calibrations span the lifetime of the counter currently in place.  I don't see any obvious effect of detector aging on P/B.  In September, 2016, I realigned the LiFH crystal, and this caused a very marginal increase in P/B.  A much more significant improvement occurred when the power supply to the static filter was reattached in January, 2017, as this prevented BSE-induced ionizations within the counter gas, thus reducing or eliminating their contribution to continuum radiation.


Hi Brian,
That is very impressive.  So I wonder why Colin MacRae insists on changing his detectors every few years?   As I said, I haven't had an instrument with sealed Xe detectors since the 1980s...

So when you say "rapid deterioration in performance" are you only referring to the need for increasing the bias voltage on the detectors?
john
« Last Edit: April 12, 2020, 03:05:52 PM by John Donovan »
The only stupid question is the one not asked!

Brian Joy

  • Professor
  • ****
  • Posts: 296
Re: PHA anomalies
« Reply #12 on: June 05, 2018, 10:03:00 PM »
So when you say "rapid deterioration in performance" are you only referring to the need for increasing the bias voltage on the detectors?

I’m also referring to alteration of the shape of the pulse amplitude distribution.  If an overlap problem can be solved more efficiently in differential mode -- and sometimes it really can -- then the presence of a “ghost” peak in that distribution can make it impossible to set even a relatively wide window (typically I use ~4 V) without excluding a significant number of X-ray counts due to the X-ray line of interest.  For a given peak count rate, electronic gain, and bias, I find that the sealed Xe detectors produce a much more stable distribution over the short term than the P-10 gas flow detectors.  For instance, on my channel 1 (TAP), I find that Si Ka, on average, produces a distribution centered at 4 V for gain = 32 and bias = 1620 V when count rate is ~5000 s-1.  However, over a period of just a day or two, the bias may have to be shifted within a range of +/-10 V in order to keep the distribution centered at 4 V, regardless of the age of the P-10 cylinder.  Obviously this can wreak havoc when operating in differential mode, and so I tend to apply overlap corrections instead when using the gas flow counters.
Brian Joy
Queen's University
Kingston, Ontario
JEOL JXA-8230

Probeman

  • Emeritus
  • *****
  • Posts: 2826
  • Never sleeps...
    • John Donovan
Re: PHA anomalies
« Reply #13 on: June 05, 2018, 10:26:32 PM »
Ah.

Yes, one can get into trouble setting the PHAs too tight due to the peak shifting to higher voltages as the count rate falls.  I always leave the PHAs "wide open" to allow all the photons in, and just let the quantitative interference correction in Probe for EPMA handle these situations.  It always manages to sort things out properly.   Almost like magic!   :)
The only stupid question is the one not asked!

Probeman

  • Emeritus
  • *****
  • Posts: 2826
  • Never sleeps...
    • John Donovan
Re: PHA anomalies
« Reply #14 on: September 28, 2022, 11:52:23 AM »
I moved this discussion to this topic because it seems more appropriate for questions about spectral interferences and PHA...

I get that this would reduce spectral interferences from high order reflections, but why not just use the spectral interference correction in PeakSight?

I know the interference correction in PeakSight a bit of a pain to use compared to quantitative interference correction in Probe for EPMA, but at least it provides a full correction for all interferences including first order interferences.

https://probesoftware.com/smf/index.php?topic=69.0

The pain? I would argue that it is not so much (especially that I have some (own written) software to manage interference corrections, and can construct the set of corrections for new setup or evaluate validity for modified... my interference corrections often gets like ~50-100 corrections and above that (max has 150 for 43 elements)). Yes Peaksigh has some pain with circular correction... which can be worked around very easily. But my most liked feature which is in Peaksight 6.5 is its ability to handle negative interference (interference with background measurements) - which works remarkably. And so I was on the same boat: "Don't use narrow window diff, use interference corrections on all orders... for correction".  However I came across some experience which changed my mind. This year I adapted measuring the Si, Mg, and Al on second order lines (which worked remarkably at the beginning) but after getting back to work after vacation I had found out that after changing of season the intensities had dropped tens of percent (!), while intensities of first order stayed comparably same. I then started searching for answer if higher diffraction order intensities depends from some physical factors. I even asked this question on Research Gate:
https://www.researchgate.net/post/Can_proportion_of_intensities_of_different_orders_from_diffracted_X-rays_depend_on_temperature

First of all, congrats on developing your own spectral interference correction software!  I only know of one other analyst who has done this and he uses the JEOL software, so without Probe for EPMA, as they say, "necessity is a mother!". Two other things come to mind when I read this. 

First, one of the things I do not like about PeakSight is that the standard (and interference) intensities are all stored in a shared database, so they need to be maintained/updated and even worse, they can be overwritten.  Probe for EPMA on the other hand, holds the standards (and interference and MAN) intensities in each user's probe run database so they can never be overwritten.  In fact, although one can easily import the standard intensities from a previous run, one can also easily and automatically re-acquire the standard intensities to obtain the most up to date intensities. I almost always re-run standards for every run every time. And there's also a public "shared" database for saving element setups in PFE, but loading the standard intensities is optional, since as you mentioned, they do get out of date.

Second, it's not discussed very much, but because most labs have difficulty controlling their laboratory temperature, one of the most under rated features in Probe for EPMA is the standard intensity drift correction, which automatically applies a drift correction to all standard intensities for any unknowns when bracketed between standard acquisitions, based on the actual time of acquisition.  This is discussed here:

https://probesoftware.com/smf/index.php?topic=168.msg725#msg725

In fact this standard intensity drift correction is automatically applied (though it can be disabled) to not only primary standards, but also interference standards and MAN standard intensities.  Though to be honest the MAN intensities (being continuum intensities) drift very little.

Now that we have such amazing temperature control in our lab (+/- 0.2C) we really don't pay much attention to these drift corrections, though they can also indicate spectrometer reproducibility problems:

https://probesoftware.com/smf/index.php?topic=330.0

Here is one such standard intensity drift test over several days in the new lab:

https://probesoftware.com/smf/index.php?topic=332.msg1741#msg1741

There answer is IT DOES! And that would then require to do often calibration of such interference corrections (for higher order lines) that brings an additional hassle, but that would be not practical as it can change during the day when high precision trace element compositions are measured. I was wondering why my Monazite Dating floats at summer from older at evening to younger toward next morning - I was doing interference correction of 2nd and 3rd order lines of REE for U,Th,Pb. After I ditched that, and moved to diff mode for these elements - analyses started to be stable and no more produce any clear daily biases.

That's the beauty of the standard drift correction in Probe for EPMA. So long as the intensity drift is relatively linear, one can set the software to automatically standardize every "N" hours, and all the unknowns will be drift corrected automatically.  And of course the drift correction is applied to each element independently, as long as there is more than one standardization in the run (for that element).

In a lab with well controlled temperatures, this sort of thing is not really needed, but in some labs where I've seen temperatures change by 4 or 5 degrees or more during the day, it is really nice to have.

And PET crystals are by far the most sensitive to these temperature changes. 
« Last Edit: September 28, 2022, 02:11:15 PM by Probeman »
The only stupid question is the one not asked!