We've been discussing modeling SF effects for inclusions in a matrix, but what if we have actual particles deposited on a substrate that we wish to characterize that are smaller than the beam interaction volume (e.g., 1 um or smaller)?
In these cases we are often interested in determining the actual composition of the particle (which is deposited or dispersed on a low Z substrate to minimize fluorescence from the substrate). Therefore, a carbon planchet works best, but sometimes a Si wafer can work unless you are trying to analyze a silicate mineral or glass particle!
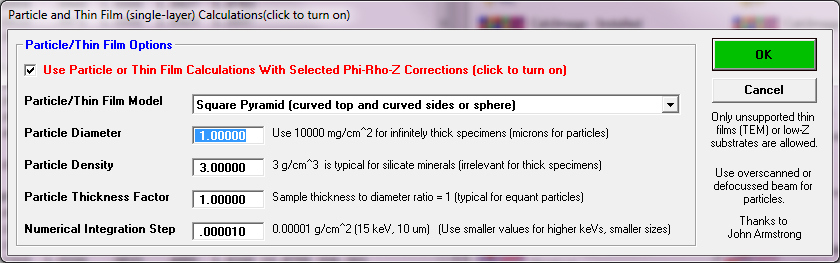
Clearly if the emitted x-rays are similar in energy, the geometric effects tend to cancel each other out, but one can get surprised, so it is a good idea if you see a low total (because some electrons are falling outside the particle onto the planchet surface), to go ahead and model with a particle geometry correction which in CalcZAF is available from the Analytical menu (in Probe for EPMA this particle correction dialog is accessed from the Calculation Options dialog from the Analyze! window) as seen here:
For example, this olivine particle composition run with the typical EPMA flat smooth surface assumption, yields these results:
OLIVINE PARTICLE-JTA-1.0UM.DAT, Sample 1
STANDARD PARAMETERS:
ELEMENT STDNUM STDCONC STDKFAC Z-BAR ABSCOR FLUCOR ZEDCOR ZAFCOR
Mg Ka 273 34.554 .2176 10.5798 1.5616 .9952 1.0220 1.5882
Fe Ka 263 54.809 .5083 18.6926 .9960 1.0000 1.0827 1.0783
Mn Ka 275 54.406 .4993 18.0833 .9971 1.0000 1.0929 1.0897
Si Ka 273 19.960 .1150 10.5798 1.6933 1.0000 1.0254 1.7363
ELEMENT STP-POW BKS-COR F(x)e F(x)s Eo Ec Eo/Ec
Mg Ka 1.0329 .9895 .7727 .4948 20.00 1.3050 15.3257
Fe Ka 1.1320 .9564 .9695 .9734 20.00 7.1120 2.8121
Mn Ka 1.1421 .9569 .9662 .9690 20.00 6.5390 3.0586
Si Ka 1.0522 .9745 .8345 .4928 20.00 1.8390 10.8755
SAMPLE: 1, ITERATIONS: 5, Z-BAR: 12.05048
ELEMENT ABSCOR FLUCOR ZEDCOR ZAFCOR STP-POW BKS-COR F(x)u Ec Eo/Ec MACs
Mg ka 1.8295 .9957 1.0088 1.8378 1.0108 .9981 .4223 1.3050 15.3257 399.740
Fe ka .9954 1.0000 1.1570 1.1517 1.2463 .9283 .9739 7.1120 2.8121 12.6621
Mn ka .9989 1.0000 1.1760 1.1747 1.2651 .9296 .9672 6.5390 3.0586 15.6175
Si ka 1.7097 .9998 1.0127 1.7310 1.0299 .9833 .4881 1.8390 10.8755 328.303
ELEMENT K-RAW K-VALUE ELEMWT% OXIDWT% ATOMIC% FORMULA KILOVOL
Mg ka .14956 .03254 5.980 9.917 24.979 4.655 20.00
Fe ka .03540 .01799 2.072 2.666 3.767 .702 20.00
Mn ka .00026 .00013 .015 .020 .028 .005 20.00
Si ka .19673 .02262 3.915 8.375 14.151 2.637 20.00
O .000 .000 .000 .000
O .000 .000 .000 .000
O 8.995 ----- 57.075 10.637
TOTAL: 20.978 20.978 100.000 18.637
And although the total is only around 21%, the atomic/formula ratios of the elements are off by some 10% from olivine stoichiometry. Here is the same intensity data but treated using the particle corrections shown in the dialog above:
OLIVINE PARTICLE-JTA-1.0UM.DAT, Sample 1
STANDARD PARAMETERS:
ELEMENT STDNUM STDCONC STDKFAC Z-BAR ABSCOR FLUCOR ZEDCOR ZAFCOR
Mg Ka 273 34.554 .2178 10.5798 1.5595 .9952 1.0220 1.5861
Fe Ka 263 54.809 .5083 18.6926 .9960 1.0000 1.0827 1.0783
Mn Ka 275 54.406 .4993 18.0833 .9971 1.0000 1.0929 1.0897
Si Ka 273 19.960 .1151 10.5798 1.6909 1.0000 1.0254 1.7338
ELEMENT STP-POW BKS-COR F(x)e F(x)s Eo Ec Eo/Ec
Mg Ka 1.0329 .9895 .7735 .4960 20.00 1.3050 15.3257
Fe Ka 1.1320 .9564 .9695 .9734 20.00 7.1120 2.8121
Mn Ka 1.1421 .9569 .9662 .9690 20.00 6.5390 3.0586
Si Ka 1.0522 .9745 .8350 .4938 20.00 1.8390 10.8755
SAMPLE: 1, ITERATIONS: 3, Z-BAR: 12.54346
E-RANGE: 10.8350, INTE-STEP: 110
Particle or thin film corrections utilized were Square Pyramid (curved top and curved sides or sphere)
Particle parameters were a particle diameter of 1 microns, a particle density of 3 gm/cm^3, a thickness factor of 1, and a numerical integration step size of 0.00001 microns.
ELEMENT ABSCOR FLUCOR ZEDCOR ZAFCOR STP-POW BKS-COR F(x)u Ec Eo/Ec MACs
Mg ka 7.9954 .9990 1.0045 8.0236 1.0034 1.0011 .0967 1.3050 15.3257 2040.46
Fe ka 6.3427 1.0000 1.1514 7.3028 1.2379 .9301 .1529 7.1120 2.8121 60.2582
Mn ka 6.5215 1.0000 1.1704 7.6325 1.2564 .9315 .1482 6.5390 3.0586 74.2905
Si ka 8.0531 1.0000 1.0085 8.1211 1.0225 .9863 .1037 1.8390 10.8755 1561.62
ELEMENT K-RAW K-VALUE ELEMWT% OXIDWT% ATOMIC% FORMULA KILOVOL NORMEL% NORMOX%
Mg ka .14956 .03258 26.142 43.352 23.434 4.373 20.00 26.2125 43.4681
Fe ka .03540 .01799 13.140 16.905 5.126 .957 20.00 13.1754 16.9501
Mn ka .00026 .00013 .099 .128 .039 .007 20.00 .099347 .128281
Si ka .19673 .02265 18.392 39.348 14.267 2.663 20.00 18.4418 39.4535
O .000 .000 .000 .000
O .000 .000 .000 .000
O 41.958 ----- 57.134 10.663 42.0711
TOTAL: 99.732 99.732 100.000 18.663 100.000 100.000
Not only is the total now much closer to 100%, but the atomic/formula ratios are closer to the expected olivine geometry.
But what about compositions where the emitted x-rays are *not* similar in energy? Let's take a "textbook" case from the John Armstrong's Lehigh course: CaF2 or fluorite. The data file used for these calculations is attached below. Let's start first with the bulk CaF2 measurement just as a "sanity check":
CaF2 bulk
SAMPLE: 1, ITERATIONS: 10, Z-BAR: 14.647
ELEMENT ABSCOR FLUCOR ZEDCOR ZAFCOR STP-POW BKS-COR F(x)u Ec Eo/Ec MACs
Ca ka 1.0043 1.0000 1.0059 1.0102 1.0467 .9610 .9343 4.0390 4.9517 153.733
F ka 4.6091 .9998 .9822 4.5261 .9497 1.0342 .1379 .6870 29.1121 6821.05
ELEMENT K-RAW K-VALUE ELEMWT% OXIDWT% ATOMIC% FORMULA KILOVOL
Ca ka .50810 .50810 51.327 ----- 33.335 8.000 20.00
F ka .10750 .10750 48.655 ----- 66.665 15.999 20.00
TOTAL: 99.983 ----- 100.000 23.999
These intensities are relative to the CaF2 standard, so we expect a reasonable measurement and we obtain a 100% total as expected (make sure the particle correction is *off* for these bulk intensities!).
Now, let's take an relatively easy case, but still with visible particle geometry effects, starting with the 10 um particle and again using bulk CaF2 (std #831) as the primary standard).
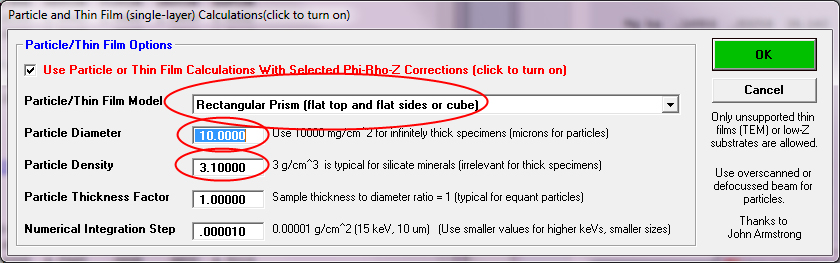
According to the lab notes, this is rectangular particle so we will use the following parameters for the 10 um particle and assume fluorite has a density of 3.1 (remember, density is important in EPMA whenever we are dealing with interaction volumes larger than our specimen).
First the 10 um particle *without*any particle corrections:
CaF2 10 um particle- use Rectangular Prism model
STANDARD PARAMETERS:
ELEMENT STDNUM STDCONC STDKFAC Z-BAR ABSCOR FLUCOR ZEDCOR ZAFCOR
Ca Ka 831 51.200 .5068 14.6320 1.0043 1.0000 1.0059 1.0102
F Ka 831 48.800 .1080 14.6320 4.6000 .9998 .9822 4.5173
ELEMENT STP-POW BKS-COR F(x)e F(x)s Eo Ec Eo/Ec
Ca Ka 1.0468 .9609 .9383 .9343 20.00 4.0390 4.9517
F Ka .9498 1.0341 .6357 .1382 20.00 .6870 29.1121
SAMPLE: 2, ITERATIONS: 10, Z-BAR: 14.36482
ELEMENT ABSCOR FLUCOR ZEDCOR ZAFCOR STP-POW BKS-COR F(x)u Ec Eo/Ec MACs
Ca ka 1.0045 1.0000 1.0063 1.0109 1.0492 .9591 .9340 4.0390 4.9517 162.053
F ka 4.3985 .9998 .9830 4.3229 .9522 1.0323 .1445 .6870 29.1121 6870.21
ELEMENT K-RAW K-VALUE ELEMWT% OXIDWT% ATOMIC% FORMULA KILOVOL
Ca ka 1.00190 .50779 51.332 ----- 31.094 8.000 20.00
F ka 1.15460 .12473 53.919 ----- 68.906 17.728 20.00
TOTAL: 105.252 ----- 100.000 25.728
Note the high total due to over correcting F ka. Next the 10 um particle *with* the rectangular particle correction:
 CaF2 10 um particle- use Rectangular Prism model
STANDARD PARAMETERS:
ELEMENT STDNUM STDCONC STDKFAC Z-BAR ABSCOR FLUCOR ZEDCOR ZAFCOR
Ca Ka 831 51.200 .5069 14.6320 1.0043 1.0000 1.0059 1.0102
F Ka 831 48.800 .1082 14.6320 4.5945 .9998 .9822 4.5119
ELEMENT STP-POW BKS-COR F(x)e F(x)s Eo Ec Eo/Ec
Ca Ka 1.0468 .9609 .9384 .9344 20.00 4.0390 4.9517
F Ka .9498 1.0341 .6374 .1387 20.00 .6870 29.1121
SAMPLE: 2, ITERATIONS: 9, Z-BAR: 14.67521
E-RANGE: 11.1924, INTE-STEP: 113
Particle or thin film corrections utilized were Rectangular Prism (flat top and flat sides or cube)
Particle parameters were a particle diameter of 10 microns, a particle density of 3.1 gm/cm^3, a thickness factor of 1, and a numerical integration step size of 0.00001 microns.
ELEMENT ABSCOR FLUCOR ZEDCOR ZAFCOR STP-POW BKS-COR F(x)u Ec Eo/Ec MACs
Ca ka .9987 1.0000 1.0058 1.0045 1.0464 .9612 .9396 4.0390 4.9517 152.004
F ka 3.9033 .9998 .9821 3.8326 .9494 1.0344 .1633 .6870 29.1121 6774.41
ELEMENT K-RAW K-VALUE ELEMWT% OXIDWT% ATOMIC% FORMULA KILOVOL NORMEL% NORMOX%
Ca ka 1.00190 .50781 51.011 ----- 33.563 8.000 20.00 51.5928 -----
F ka 1.15460 .12488 47.861 ----- 66.437 15.835 20.00 48.4072 -----
TOTAL: 98.872 ----- 100.000 23.835 100.000 -----
As we can see, the total is much better, almost 99%, so a decent job. More importantly the Ca:F atomic ratio went from 31:69 without the particle correction, to 33:66 with the particle correction, the latter which is what we should expect from CaF2.
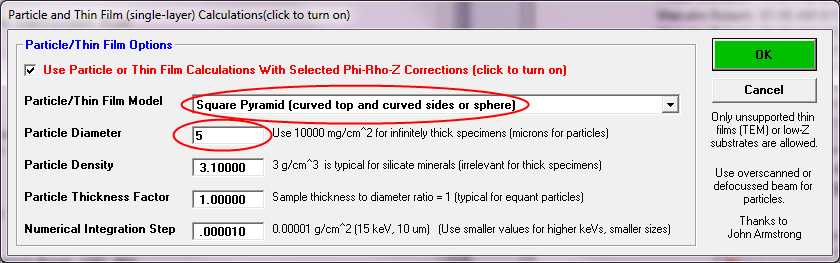
Here is the next example, a 5 um CaF2 particle also calculated with a square pyramid geometry:
 CaF2 5 um particle- use Square Pyramid model
STANDARD PARAMETERS:
ELEMENT STDNUM STDCONC STDKFAC Z-BAR ABSCOR FLUCOR ZEDCOR ZAFCOR
Ca Ka 831 51.200 .5069 14.6320 1.0043 1.0000 1.0059 1.0102
F Ka 831 48.800 .1082 14.6320 4.5945 .9998 .9822 4.5119
ELEMENT STP-POW BKS-COR F(x)e F(x)s Eo Ec Eo/Ec
Ca Ka 1.0468 .9609 .9384 .9344 20.00 4.0390 4.9517
F Ka .9498 1.0341 .6374 .1387 20.00 .6870 29.1121
SAMPLE: 3, ITERATIONS: 8, Z-BAR: 14.64268
E-RANGE: 11.1911, INTE-STEP: 113
Particle or thin film corrections utilized were Square Pyramid (curved top and curved sides or sphere)
Particle parameters were a particle diameter of 5 microns, a particle density of 3.1 gm/cm^3, a thickness factor of 1, and a numerical integration step size of 0.00001 microns.
ELEMENT ABSCOR FLUCOR ZEDCOR ZAFCOR STP-POW BKS-COR F(x)u Ec Eo/Ec MACs
Ca ka 1.7920 1.0000 1.0059 1.8025 1.0468 .9609 .5236 4.0390 4.9517 138.020
F ka 4.7739 .9998 .9822 4.6879 .9497 1.0342 .1335 .6870 29.1121 6119.71
ELEMENT K-RAW K-VALUE ELEMWT% OXIDWT% ATOMIC% FORMULA KILOVOL NORMEL% NORMOX%
Ca ka .50400 .25545 46.045 ----- 33.300 8.000 20.00 51.2971 -----
F ka .86220 .09325 43.717 ----- 66.700 16.024 20.00 48.7029 -----
TOTAL: 89.762 ----- 100.000 24.024 100.000 -----
The total isn't so great (~90%), but the stoichiometry is excellent and therefore the "normalized" elemental % values (Ca = 51.29 and F = 48.7) are excellent as seen in the NORMEL %" column.


 All Electron Probe Micro-Analysts are welcome to register and post!