Is it a fair use of the modified Kanaya-Okayama range equation:
...
Does this make sense at all, or am I totally misusing this relationship?
Many thanks!
Your work makes sense. I am impressed that you utilized the Yukawa potential Z fraction for the average Z calculation, though I cannot say that we've ever tested that relation with the K-O equation. But since the elements in HfO2 are quite different in A/Z, and the K-O equation was calibrated using pure elements, I would think that makes sense.
Though I suspect the accuracy of K-O will be quite limited in general especially at low voltages, if you are attempting to characterize the HfO2 layer thickness.
For those interested here are some calculations in Standard for HfO2 using the Output | Calculate Alternative Zbars menu:
ELEM: Hf O
XRAY: la ka
ELWT: 84.797 15.203
ATWT: 178.490 16.000
KFAC: .7705 .0508
ZCOR: 1.1006 2.9944
AT% : 33.333 66.667
ELEMENT: Hf O
CONC FRAC: .8480 .1520
ZFRAC 1.0: .8182 .1818
C/Z %DIF: -3.5133 19.5966
ZFRAC 0.7: .6995 .3005
C/Z %DIF: -17.5094 97.6644
ATOM FRAC: .3333 .6667
ELAS FRAC: .9026 .0974
A/Z Ratio: 2.4790 2.0000
Zbar (Mass fraction) = 62.2703
Zbar (Electron (Z^1.0) fraction) = 60.3636
Zbar (Mass/Electron (Z^1.0) fraction Zbar % difference) = 3.06195
Zbar (Electron (Z^0.7) fraction) = 52.7679
Zbar (Mass/Electron (Z^0.7) fraction Zbar % difference) = 15.2600
Zbar (Elastic fraction) = 65.7644
Zbar (Atomic fraction) = 29.3333
Zbar (Saldick and Allen, for backscatter) = 60.3636
Zbar (Joyet et al.) = 42.0793
Zbar (Everhart) = 70.7500
Zbar (Donovan Z^0.5) = 46.4000
Zbar (Donovan Z^0.667, Yukawa Potential, Z^2/3) = 51.7786
Zbar (Donovan Z^0.70) = 52.7679
Zbar (Donovan Z^0.707, 1/SQRT(2)) = 52.9742
Zbar (Donovan Z^0.80) = 55.5888
Zbar (Donovan Z^0.85) = 56.8932
Zbar (Donovan Z^0.90) = 58.1242
Zbar (Bocker and Hehenkamp for continuum) = 38.5584
Zbar (Duncumb Log(Mass) for continuum) = 51.5540
A better effort might be to utilize pr(z) curves such as those calculated using CalcZAF as described here:
https://probesoftware.com/smf/index.php?topic=1070.0Using this method, at 4 keV we obtain the following curves for HfO2 with a trace of Si:
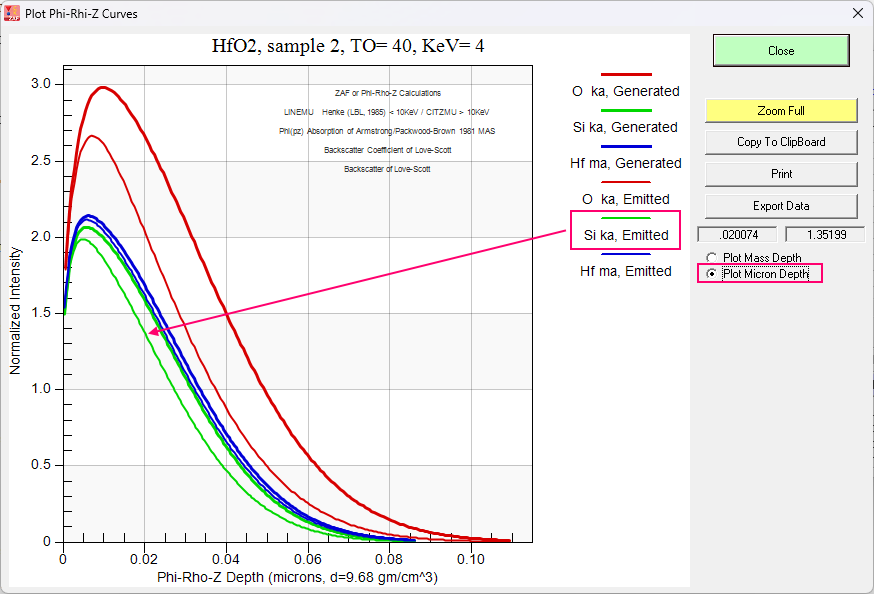
Note that the curves are all normalized to the surface intensity, but one can see that the emitted Si Ka signal starts to drop around 200 nm.
Of course the most quantitative method would be to model the different thin film thicknesses in PENEPMA or another Monte-Carlo software as described here using a bi-layer geometry model:
https://probesoftware.com/smf/index.php?topic=57.0But if you are attempting to simply quantify the HfO2 layer thickness (and/or chemistry), I think your best bet would be to utilize multi-voltage measurements with the BadgerFilm (or STRATAGem) software which is specifically designed for this:
https://probesoftware.com/smf/index.php?board=37.0


 If you are a member, please feel free to add your website URL to your forum profile